Scrolling stories: Ebook use in Canada 2025
Ebooks are an integral part of the Canadian book market. Nearly 14% of all books purchased by Canadians in 2025 were ebooks, according to the Canadian Book Consumer Study 2025. At the same time, 71% of Canadians reported reading an ebook in 2025 in the Canadian Leisure & Reading Study 2025. BookNet Canada has been tracking the impact of ebooks since our 2008 report Click to Continue, which modeled the future impact of ebooks on consumer spending, and this report continues the work to track ebook use in Canada, revealing the buying, borrowing, and reading habits of Canadian ebook consumers.
Table of Contents
- Introduction
- Highlights
- Ebooks in Canada
- Ebook buying
- Ebook borrowing
- Ebook reading
- About BookNet Canada
- Appendix A: Demographics of Canadian ebook buyers from the Canadian Book Consumer Study 2025
- Appendix B: Demographics of Canadian ebook borrowers from the Canadian Book Consumer Study 2025
- Appendix C: Demographics of Canadian ebook readers from the Canadian Leisure & Reading Study 2025
Introduction
Ebooks are an integral part of the Canadian book market. Nearly 14% of all books purchased by Canadians in 2025 were ebooks, according to the Canadian Book Consumer Study 2025. At the same time, 71% of Canadians reported reading an ebook in 2025 in the Canadian Leisure & Reading Study 2025. BookNet Canada has been tracking the impact of ebooks since our 2008 report Click to Continue, which modeled the future impact of ebooks on consumer spending, and this report continues the work to benchmark ebook use in Canada, revealing the buying, borrowing, and reading habits of Canadian ebook consumers.
Methodology
This study incorporates data from our annual publications, the Canadian Book Consumer Study 2025 and Canadian Leisure & Reading Study 2025. This study relies on both published and unreleased data from these consumer surveys.
The Canadian Book Consumer Study 2025 includes results from our annual Canadian Book Consumer survey which was fielded twice in 2025: in July and December. All told, the study contains data from 1,979 Canadians, 976 of whom were considered book buyers and 466 of whom were considered book borrowers.
For the purposes of this study, 327 Canadians surveyed for the Canadian Book Consumer Study 2025 were considered ebook buyers and 135 Canadians were considered ebook borrowers.
The Canadian Leisure & Reading Study 2025 presents data from a survey of Canadians fielded in January 2026. The survey queried Canadians about how they spent their leisure time in 2025, with a focus on reading. The 2025 edition of this study contains data from 1,278 Canadians, 1,005 of whom were considered readers.
For the purposes of this study, 718 Canadians surveyed for the Canadian Leisure & Reading Study 2025 were identified as ebook readers, having read at least one ebook in 2025.
For both the Canadian Book Consumer Study 2025 and Canadian Leisure & Reading Study 2025:
- The survey was fielded online through an external provider, to their consumer panel of nearly two million Canadians. The survey was limited to those with internet access who were able and wanted to participate in our panel in exchange for non-monetary incentives as offered by our survey partner (e.g., loyalty reward “point” programs).
- Respondents were English-speaking Canadians, 18 years of age or older, located throughout Canada, and representative of the Canadian population based on age, gender, and geographical region. Selective sampling was based on demographic results from Statistics Canada.
- There is a margin of error of ±3 percentage points at the 95% confidence level, meaning that statistics for this group could fluctuate about 3% in either direction if the survey was fielded to the entire Canadian population.
- The data is unweighted.
This study was prepared by BookNet Canada staff.
Ebooks in Canada
Canadians are reading ebooks: 71% of all Canadian readers surveyed for the Canadian Leisure & Reading Study 2025 read an ebook in 2025 and, according to the Canadian Book Consumer Study 2025, 34% of all Canadian book buyers bought ebooks and 29% of all Canadian book borrowers borrowed ebooks last year.
Canadian ebook consumers of all types in 2025 share a similar demographic profile to all Canadian book consumers, with some exceptions:
- Canadian ebook buyers are more likely to identify as a man (53%), be between 25 and 34 years old (26%), live in an urban area (61%), and be employed full time (62%).
- Canadian ebook borrowers are more likely to identify as a woman (67%), be between 45 and 54 years old (20%), live in an urban area (67%), and have a graduate or professional degree (24%).
- Canadian ebook readers are more likely to be between 18 and 29 years old (26%), have a graduate or professional degree (17%), and be providing care for someone, such as a parent or child (40%).
You can find full demographics at the end of the report for Canadian ebook buyers (Appendix A), borrowers (Appendix B), and readers (Appendix C), alongside the demographics of all Canadians for comparison.
The following study is divided into three sections:
- ebook buying, which delves into the behaviours of ebook buyers as reported in the Canadian Book Consumer Study 2025;
- ebook borrowing, which explores the behaviours of ebook borrowers as reported in the Canadian Book Consumer Study 2025; and
- ebook reading, which analyzes the behaviours of ebook readers, regardless of ebook acquisition method, as reported in the Canadian Leisure & Reading Study 2025.
Ebook buying
In the Canadian Book Consumer Study 2025, we found that 34% of Canadian book buyers bought an ebook in 2025. Though ebook buyers were mostly buying ebooks, making up 50% of all their book purchases, they also bought other formats: 33% of their purchases were print books and 17% were audiobooks. This is distinctly different compared to all book purchases reported by the Canadian book consumer survey in 2022, where 30% of purchases were ebooks, while 55% were print books and 16% were audiobooks.
Looking year over year, ebook purchasing has remained steady for Canadian book consumers hovering below a third of all book purchases — 28% in 2023, up to 29% in 2024, and 30% in 2025.
Ebook pricing
Most ebook buyers spent between $1 and $49 on ebooks in a given month in 2025 (40%). Other ebook buyers spent $50 to $99 (24%) or $100 or more (33%) on ebooks in a given month. This is similar to all Canadian book buyers in 2025, most of whom also spent $1 to $49 on books in a given month (51%), while others spent $50 to $99 (23%), $100 or more (23%), or $0 (2%).
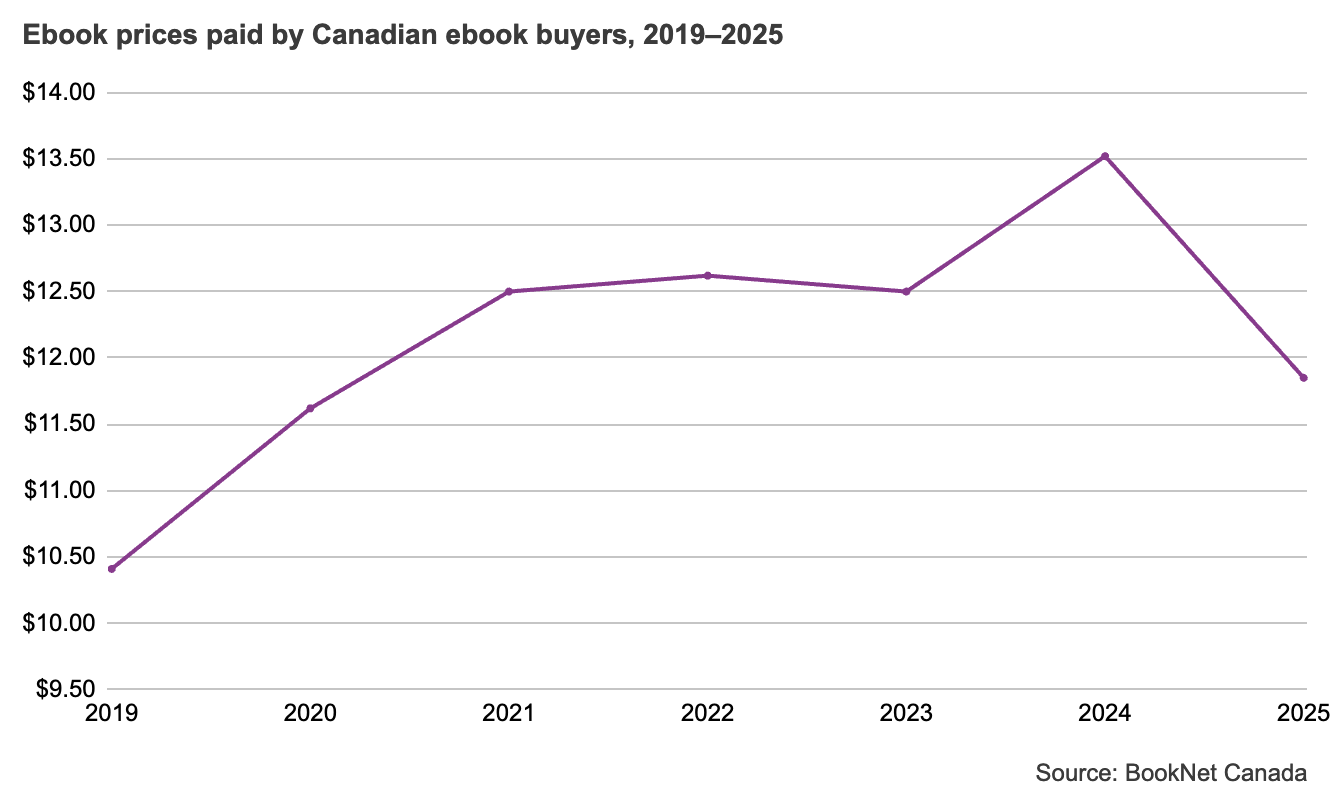
Over the entire year, Canadian ebook buyers said they spent an average of $11.85 per ebook. After increasing from 2019 to 2022, it’s been up and down from 2023 to 2025 as seen in the graph below. This is different than for print books, the average price per book for both hardcovers and paperbacks is at the highest it has been looking back as far as 2019 according to the Canadian Book Consumer Study 2025.
Find our source data here.
Over a third of Canadian ebook buyers paid full price for ebooks in 2025 (38%) — less than the 60% of all book buyers who paid full price for their books in 2025. Ebook buyers also took part in ebook-related loyalty programs, such as:
- Amazon Prime — 52% of ebook buyers vs. 41% of all buyers
- Indigo Plum Rewards — 30% of ebook buyers vs. 41% of all buyers
- Independent bookstore’s loyalty program — 9% of ebook buyers vs. 4% of all buyers
- Kobo Super Points — 12% of ebook buyers vs. 5% of all buyers
| 2022 | 2023 | 2024 | 2025 | |
|---|---|---|---|---|
| Paid full price | 45% | 45% | 47% | 38% |
| Book was discounted/in a sale/had money off | 32% | 30% | 27% | 33% |
| Other special price/offer | 8% | 12% | 11% | 9% |
| Bought as part of subscription | 7% | 7% | 6% | 9% |
| Used a coupon/money-off voucher from the shop | 6% | 4% | 7% | 7% |
| Bought as part of multi-buy deal (e.g., 3 for 2, 2 for $20) | 2% | 1% | 3% | 5% |
Overall, more than half of Canadian ebook buyers reported that they received excellent value for money from their ebook purchase (56%), with 33% reporting good value, 9% reporting fair value, 1% reporting poor value, and none reporting bad value. In contrast, only 50% of all Canadian book buyers reported receiving excellent value for the books they purchased, across all formats.
Ebook purchasing behaviours
Unsurprisingly, the vast majority of Canadian ebook buyers in 2025 purchased ebooks online at 93%. These purchases occurred either at an online retailer (50%), through a mobile app (30%), or as a digital download (13%).
| 2022 | 2023 | 2024 | 2025 | |
|---|---|---|---|---|
| Online | 46% | 44% | 47% | 50% |
| Mobile app | 30% | 32% | 32% | 30% |
| Digital download site | 19% | 19% | 16% | 13% |
| Chain bookstores | 2% | 1% | 2% | 2% |
| Indie bookstores | 1% | 1% | 1% | 3% |
| Book club | 1% | 1% | 1% | 0% |
| General retailers | 0% | 1% | 1% | 1% |
| Discount stores | 0% | 0% | 0% | 1% |
The most popular reasons why Canadian ebook buyers purchased their books at a specific location in 2025 were:
- good price/offer/promo — 41%;
- convenient place to shop — 32%;
- book(s) in stock/available immediately — 27%;
- good selection of books — 25%;
- easy checkout process to buy books — 22%; and
- easy to navigate — 22%.
Ebook buyers were more influenced by price than were all buyers. Only 29% of Canadian book buyers identified good price/offer/promo as the reason to purchase at a specific place.
In 2025, Canadian ebook buyers increasingly became aware of the ebooks they purchased by reading another book by the same author (23%), browsing or searching online or in person (23%), recommendations or reviews (20%), and social media (12%).
For the first time in 2025, we asked about AI tools as drivers of awareness and 3% of ebook buyers chose AI tools as a driver of awareness for the books they bought.
| 2022 | 2023 | 2024 | 2025 | |
|---|---|---|---|---|
| Read other books by author/illustrator | 26% | 24% | 23% | 23% |
| Browsing or searching online or in person | 23% | 17% | 23% | 23% |
| Recommendation/review | 19% | 20% | 17% | 20% |
| Social media (e.g., Facebook, Twitter, Instagram, Pinterest, etc.) | 13% | 13% | 15% | 12% |
Ebook buyers and all Canadian book buyers found the ebooks they purchased online in 2025 in much of the same ways:
- Searching for a specific book — 32% of ebook buyers vs. 40% of all book buyers
- Browsing by genre/subject — 25% of ebook buyers vs. 20% of all book buyers
- Browsing by author — 10% of ebook buyers vs. 8% of all book buyers
- Searching for another book — 6% of ebook buyers vs. 8% of all book buyers
- Sales/offers/daily deals section — 5% of all ebook buyers vs. 3% of all book buyers
Much like past years, most ebook buyers made the decision to buy the ebooks they purchased based on their interest in the ebook’s subject (39%). Other purchasing reasons can be found in the table below.
| 2022 | 2023 | 2024 | 2025 | |
|---|---|---|---|---|
| Like/interested in subject | 29% | 30% | 31% | 39% |
| Low price/on special offer | 21% | 21% | 20% | 25% |
| Description of the book | 20% | 19% | 24% | 21% |
| Like the series | 21% | 22% | 18% | 19% |
| Recommendation/review | 17% | 18% | 18% | 16% |
The majority of ebook purchases in 2025 were planned.
- 33% planned ahead to buy a particular ebook at a specific time.
- 22% planned to buy a particular ebook, but not necessarily at a specific time.
- 20% did not plan to buy an ebook at a specific time and made an impulse purchase.
- 19% planned to buy an ebook at that specific time, but had not planned to buy a particular ebook.
More than all Canadian book buyers, ebook buyers bought, rather than borrowed, ebooks for the following reasons:
- to have it right away — 18% of ebook buyers vs. 14% of all buyers;
- to be able to reread it whenever they want, as much as they want — 16% of ebook buyers vs. 13% of all buyers;
- because it was cheap — 14% of ebook buyers vs. 8% of all buyers.
Almost all ebook buyers, 96%, reported buying the book for themselves rather than for someone else compared with 84% of all Canadian book buyers in 2025.
As book consumers, ebook buyers were more likely than all Canadian book buyers in 2025 to agree or sometimes agree with the statements:
- I add books to my online cart to get free shipping — 79% of ebook buyers vs. 67% of all buyers.
- The environmental impact of the book industry matters to me — 78% of ebook buyers vs. 70% of all buyers.
- I see marketing campaigns/ads for the types of books I’m interested in — 78% of ebook buyers vs. 69% of all buyers.
- I prefer books that have been published in the last year or so (new releases) over older books — 77% of ebook buyers vs. 72% of all buyers.
- Having books in accessible formats (e.g., braille, large print) matters to me — 77% of ebook buyers vs. 69% of all buyers.
- I prefer to pay for a bundle of content more so than buying one single item — 77% of ebook buyers vs. 68% of all buyers.
- I finish reading a book before I buy or borrow a new one to start — 76% of ebook buyers vs. 74% of all buyers.
- I would like to know if any aspect of my book has been produced using AI (content, index, back cover copy, etc.). — 75% of ebook buyers vs. 69% of all buyers.
- I pre-order books/buy books pre-sale — 72% of ebook buyers vs. 59% of all buyers.
- I buy whichever book is least expensive, regardless of its format — 67% of ebook buyers vs. 50% of all buyers.
| Yes | Sometimes | No | Yes and sometimes | |
|---|---|---|---|---|
| I look for sales, promotions, and coupons when I shop for books. | 61% | 31% | 8% | 92% |
| I compare book prices before making a purchase. | 51% | 33% | 16% | 84% |
| I finish reading a book before I buy or borrow a new one to start. | 45% | 31% | 24% | 76% |
| Having books in accessible formats (e.g. braille, large print, …) matters to me. | 44% | 33% | 23% | 77% |
| I add books to my online cart to get free shipping. | 43% | 37% | 21% | 79% |
| The environmental impact of the book industry matters to me. | 39% | 38% | 22% | 78% |
| I would like to know if any aspect of my book has been produced using AI (content, index, back cover copy, etc.). | 50% | 25% | 25% | 75% |
| I buy whichever book is least expensive, regardless of its format (print book, ebook, audiobook). | 31% | 36% | 33% | 67% |
| I pre-order books/buy books pre-sale. | 29% | 43% | 28% | 72% |
| I see marketing campaigns/ads for the types of books I’m interested in. | 29% | 49% | 22% | 78% |
| I prefer to pay for a bundle of content more so than buying one single item. | 28% | 49% | 23% | 77% |
| I prefer books that have been published in the last year or so (new releases) over older books. | 27% | 50% | 23% | 77% |
Ebook subjects
In 2025, most ebooks purchased by Canadian ebook buyers were Adult books, at 83% of all ebook purchases. Of the rest, 15% were Young Adult books and 2% were Children’s books. The majority of these books were Fiction titles (71%), with the rest being Non-Fiction (29%).
The most popular Fiction subjects for ebook buyers in 2025 were:
- Romance — 19% of ebook purchases vs. 10% of all book purchases
- Suspense and Thriller — 16% of ebook purchases vs. 16% of all purchases
- Fantasy — 13% of ebook purchases vs. 17% of all purchases
- Mystery and Detective — 13% of ebook purchases vs. 13% of all purchases
Meanwhile, the most popular Non-Fiction subjects were:
- Self-Help — 21% of ebook purchases vs. 19% of all purchases
- History — 16% of ebook purchases vs. 13% of all purchases
- Biography and Memoir — 15% of ebook purchases vs. 20% of all purchases
Apart from subject categories, Canadian ebook buyers read broadly in 2025 and searched for:
- Books by Canadian authors/illustrators — 44% of ebook purchasers vs. 38% of all buyers
- Books about Canada or regions within Canada — 31% of ebook purchasers vs. 29% of all buyers
- Books about a group or culture written by people from that group or culture — 30% of ebook purchasers vs. 22% of all buyers
- Books that are partly or fully written in another language — 18% of ebook purchasers vs. 11% of all buyers
- Books about Indigenous peoples — 17% of ebook purchasers vs. 14% of all buyers
- Books by Indigenous authors/illustrators — 16% of ebook purchasers vs. 13% of all buyers
Ebook borrowing
In 2025, 29% of all Canadian book borrowers borrowed ebooks. Half of all books borrowed from the library by ebook borrowers in 2025 were ebooks (50%) — the other 32% were print books and 18% were audiobooks. At the library overall, 17% of books borrowed by Canadian book borrowers were ebooks, while 74% were print books and 9% were audiobooks.
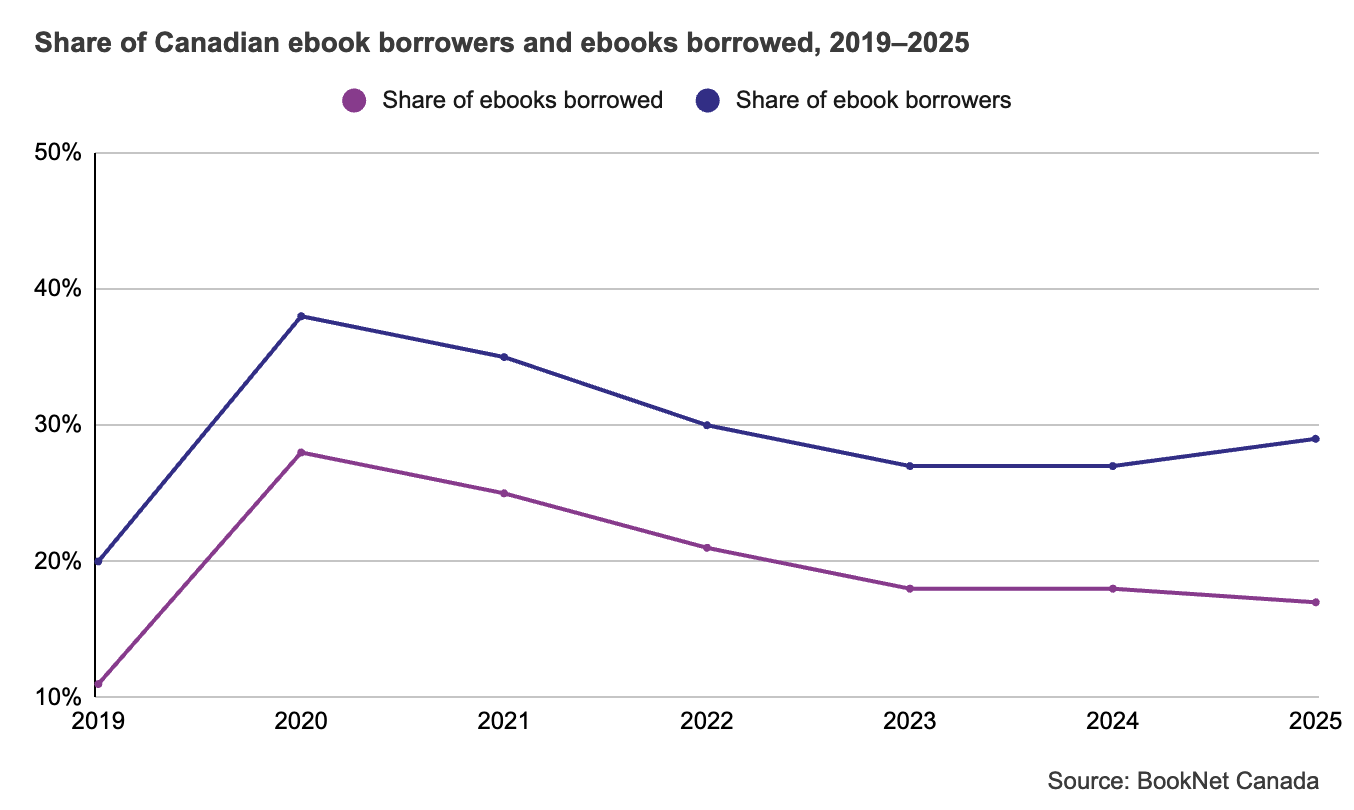
When we look at all Canadian book borrowers, we see that the share of ebook borrowers peaked in 2020 at 38%, but has since levelled off around 30%. We can also see that the share of ebooks that were borrowed also peaked in 2020 at 28% of all book formats borrowed.
Find our source data here.
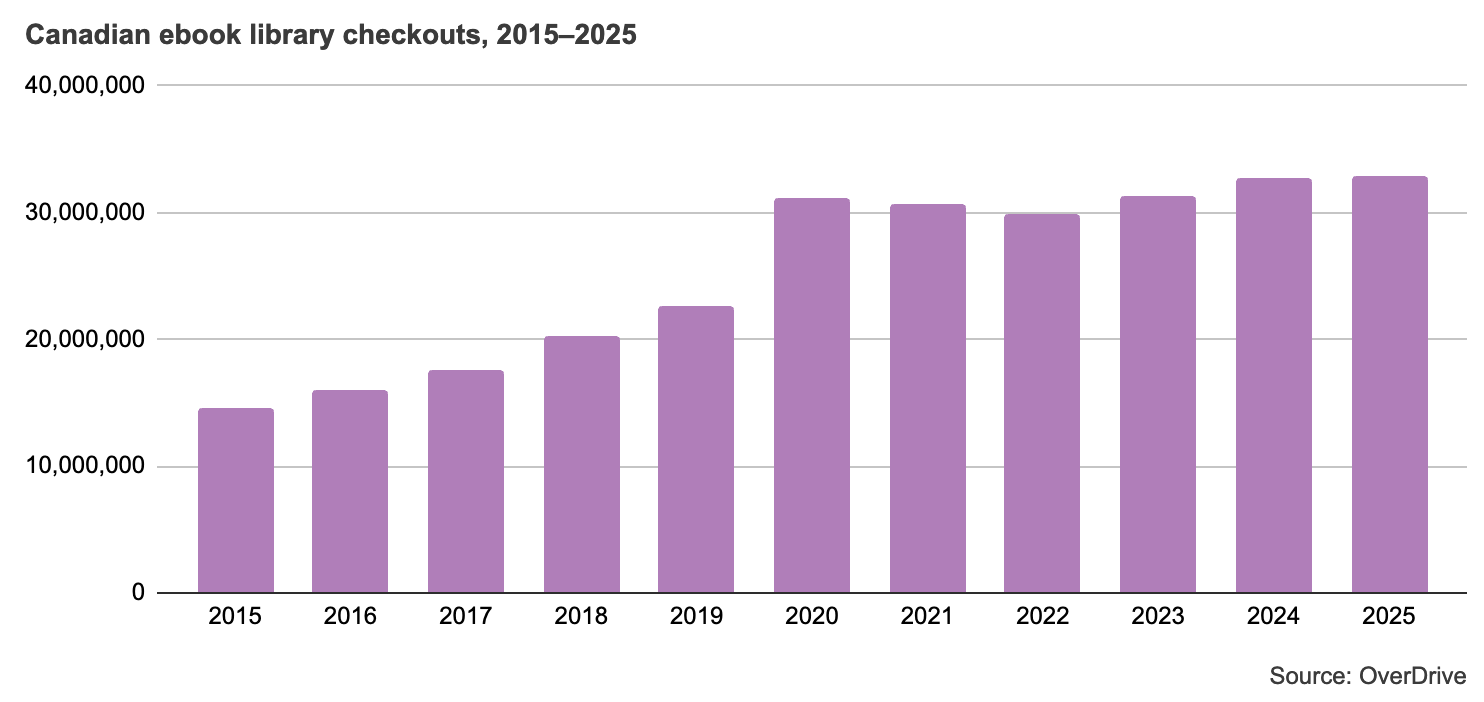
When we look at data reported by OverDrive, the world’s leading digital reading platform for libraries and schools, we can also see a large jump in ebook checkouts from 2019 to 2020, but the number of checkouts remained high from 2020 onwards.
Find our source data here.
Ebook borrowing behaviours
Canadian ebook borrowers visited the library both online and in-person in 2025 for a variety of reasons, including:
- to pick up hold(s) — 48%;
- to browse for books to borrow — 25%; and
- to put books/materials on hold — 24%.
| 2022 | 2023 | 2024 | 2025 | |
|---|---|---|---|---|
| To pick up hold(s) | 38% | 39% | 37% | 48% |
| To browse displays and shelves for books to borrow | 26% | 28% | 28% | 25% |
| To put books/materials on hold | 22% | 25% | 26% | 24% |
| To discover a new book, author, and/or illustrator | 23% | 28% | 27% | 19% |
| To request or suggest a book be added to the library | 8% | 10% | 16% | 17% |
| To use the printer/photocopier | 7% | 12% | 12% | 17% |
| To study/work/research | 10% | 18% | 21% | 16% |
Just like all Canadian library book borrowers, most ebook borrowers only borrowed books from the library in 2025 (70% of ebook borrowers and 74% of all Canadian borrowers). For the ebook borrowers who did borrow other things, they mostly borrowed magazines (10%).
Yet, ebook borrowers were almost as likely as all book borrowers to borrow books for themselves and other people in 2025:
- 53% of ebook borrowers borrowed generally for themselves, compared to 64% of all borrowers.
- 20% of ebook borrowers borrowed generally for another adult, compared to 15% of all borrowers.
- 10% of ebook borrowers borrowed generally for a young adult, compared to 9% of all borrowers.
- 16% of ebook borrowers borrowed generally for a child, compared to 18% of all borrowers.
The most popular ways Canadian ebook borrowers became aware of the books they borrowed in 2025 were:
- searching for a specific book — 53%;
- browsing by genre/subject — 39%;
- browsing by author/illustrator — 39%;
- having read other books by the author/illustrator — 36%;
- getting a recommendation or reading a review — 24%; and
- searching for another book — 22%.
For the first time in 2025, we asked about AI tools as drivers of awareness; 0% of ebook borrowers chose AI tools as a driver of awareness for the books they borrowed.
Ebook borrowers, like all Canadian book borrowers, were most likely to take these actions in 2025 when deciding whether or not to borrow a book:
- Read the book description — 53% of ebook borrowers vs. 48% of all borrowers.
- Check to see if the library has it — 50% of ebook borrowers vs. 45% of all borrowers.
- Read reviews about the book — 36% of ebook borrowers vs. 30% of all borrowers.
- See what subject/genre the book is in — 26% of ebook borrowers vs. 28% of all borrowers.
- See who the author/illustrator is — 26% of ebook borrowers vs. 24% of all borrowers.
| 2022 | 2023 | 2024 | 2025 | |
|---|---|---|---|---|
| Read the book description | 53% | 54% | 51% | 53% |
| Check to see if the library has it | 52% | 45% | 45% | 50% |
| Read reviews about the book | 34% | 33% | 34% | 36% |
| See what subject/genre the book is in | 30% | 33% | 24% | 26% |
| See who the author/illustrator is | 28% | 24% | 23% | 26% |
| Look at the cover | 22% | 31% | 21% | 23% |
| Read or listen to a sample or excerpt | 19% | 21% | 18% | 19% |
| Read about the author/illustrator | 14% | 17% | 19% | 17% |
| Compare the price in multiple places | 11% | 14% | 20% | 19% |
Canadian ebook borrowers borrowed books from the library instead of buying them in 2025 because they wanted to save money (55%) or they didn’t want to spend money on them (38%).
Ebook borrowers agree or sometimes agree with the statements:
- I look for sales, promotions, and coupons when I shop for books — 88% of ebook borrowers vs. 84% of all borrowers.
- I compare book prices before making a purchase — 81% of ebook borrowers vs. 81% of all borrowers.
- Having books in accessible formats (e.g., braille, large print) matters to me — 77% of ebook borrowers vs. 71% of all borrowers.
- The environmental impact of the book industry matters to me — 77% of ebook borrowers vs. 73% of all borrowers.
- I see marketing campaigns/ads for the types of books I’m interested in — 77% of ebook borrowers vs. 67% of all borrowers.
- I finish reading a book before I buy or borrow a new one to start — 74% of ebook borrowers vs. 78% of all borrowers.
Ebook subjects
The Canadian Leisure & Reading Study 2025 tracks the book subjects read by Canadian ebook borrowers in 2025 and in it we found that they read mostly Fiction (68%) and Non-Fiction (59%) titles, with some Young Adult (15%) and Children’s books (11%). The most popular Fiction subjects read by Canadian ebook borrowers in 2025 were:
- Mystery and Detective — 33%;
- Romance — 25%;
- Science Fiction — 25%;
- Fantasy — 20%; and
- Historical Fiction — 20%.
The most popular Non-Fiction subjects for Canadian ebook borrowers in 2025 were:
- History — 22%;
- True Crime — 19%;
- Biography and Memoir — 15%; and
- Self-Help — 15%.
The Canadian Book Consumer Study 2025 offers insight into the range of books Canadian ebook borrowers search for. Canadian ebook borrowers searched for:
- Books by Canadian authors/illustrators — 54%
- Books about Canada or regions within Canada — 36%
- Books about a group or culture written by people from that group or culture — 34%
- Books that are partly or fully written in another language — 19%
- Books about Indigenous peoples — 19%
- Books by Indigenous authors/illustrators — 18%
Ebook reading
According to the Canadian Leisure & Reading Study 2025, 71% of all Canadian readers read at least one ebook in 2025. This number has been steadily increasing since 2019 when it was 61%. Most Canadian ebook readers in 2025 read an ebook once a week (26%), with 8% reading more than one a day and 18% reading once a day.
| 2022 | 2023 | 2024 | 2025 | |
|---|---|---|---|---|
| More than once a day | 8% | 9% | 9% | 8% |
| Once a day | 17% | 18% | 18% | 18% |
| Once a week | 23% | 23% | 25% | 26% |
| Once a month | 18% | 18% | 19% | 15% |
| Less than once a month | 15% | 13% | 14% | 14% |
| A few times a year | 18% | 19% | 15% | 19% |
Most Canadian ebook readers reported having the same amount of time for reading ebooks in 2025 than in past years (56%), while 26% said they had more time. We can compare that to all Canadian readers where 58% said their ebook reading time stayed the same in 2025, 19% reported an increase, and 17% a decrease.
| 2022 | 2023 | 2024 | 2025 | |
|---|---|---|---|---|
| Increased | 24% | 26% | 28% | 26% |
| Stayed the same | 53% | 53% | 53% | 56% |
| Decreased | 20% | 18% | 15% | 16% |
| Unsure | 3% | 3% | 4% | 3% |
Over half of all Canadian ebook readers in 2025 read between one and five ebooks last year (59%), while 22% read 6 to 11 ebooks, 15% read 12 to 49 ebooks, and 4% read 50 or more.
Ebook readers also read books in other formats in 2025 — 94% read print books and 74% listened to audiobooks. Altogether, 24% of Canadian ebook readers prefer ebooks as a format in 2025 — higher than the 18% of all Canadian readers who prefer ebooks. That being said, 47% of all ebook readers in 2025 prefer print books, 20% prefer audiobooks, and 9% don’t have a preferred book format.
More than all Canadian readers, ebook readers were more likely to agree or sometimes agree that their choice of book format depends on which is available or stocked (80% of ebook readers vs. 72% of all readers). At the same time, 43% of ebook readers agreed or sometimes agreed that they wouldn’t read a book in another format if an ebook was not available (16% won’t and 27% sometimes won’t).
Ebook selection
Most ebook readers spent from $1-$49 on ebooks in 2025 (36%), with many others spending $50-99 (20%), $100-149 (11%), $150-199 (5%), or $200 or more (12%) on ebooks. Only 15% of Canadian ebook readers did not spend any money on ebooks in 2025, compared to 17% in 2024.
In 2025, 82% of Canadian ebook readers agreed or sometimes agreed that they get good value for ebooks at the price they pay — 41% agreed and 41% sometimes agreed.
The most popular way Canadian ebook readers acquired ebooks in 2025 was from a public library (21%). The next most popular acquisition sources were an online retailer or app or a free internet site — at 19% each. Another 12% of ebook readers also acquired books from a subscription service.
| 2022 | 2023 | 2024 | 2025 | |
|---|---|---|---|---|
| From a public library (e.g., OverDrive, Libby, Hoopla, CloudLibrary, etc.) | 19% | 23% | 22% | 21% |
| From an online retailer or via a retailing app (e.g., Kobo, Amazon, Barnes & Noble, etc.) | 21% | 19% | 20% | 19% |
| From a free internet site (e.g., Project Gutenberg, etc.) | 20% | 19% | 16% | 19% |
| From a subscription service (e.g., Kobo, Scribd, Kindle Unlimited, Marvel Unlimited, etc.) | 11% | 11% | 13% | 12% |
| From a general retailer (e.g., Costco, Walmart, Shoppers Drug Mart, grocery store, etc.) | 7% | 7% | 7% | 8% |
| I received them as a gift | 9% | 7% | 6% | 8% |
| I borrowed them from someone I know | 6% | 8% | 8% | 7% |
| From a free illegal site (a torrent, Dropbox, etc.) | 5% | 4% | 5% | 5% |
| Other | 2% | 2% | 3% | 2% |
The most popular way that Canadian ebook readers discovered the books they read was by word of mouth (34%), similar to all Canadian readers at 36%. Canadian ebook readers also discovered books through:
- social media — 27%;
- the public library — 25%;
- bookstores — 24%; and
- online book retailers — 20%.
What influenced ebook readers’ choice to read a specific book the most in 2025 was the subject or topic (37%), the book’s description (32%), or the author (30%).
| 2022 | 2023 | 2024 | 2025 | |
|---|---|---|---|---|
| The subject/topic | 42% | 36% | 35% | 37% |
| The book’s description | 29% | 26% | 27% | 32% |
| The author | 31% | 28% | 30% | 30% |
| Recommendation(s) | 25% | 26% | 26% | 24% |
| The main character/series | 18% | 17% | 18% | 19% |
| It’s a bestseller | 16% | 17% | 18% | 14% |
| It was adapted for the screen | 8% | 8% | 10% | 12% |
| Sample, excerpt, or preview of the book | 10% | 11% | 11% | 11% |
| It has content/information needed for reference | 12% | 15% | 12% | 11% |
| Front cover or interior images / inside of books | 8% | 10% | 9% | 11% |
| It was trending on social media (TikTok, Instagram, YouTube, Twitter, etc.) | 9% | 12% | 13% | 11% |
| The book comes with a readers’ guide or discussion questions | 4% | 6% | 5% | 9% |
| It was selected for me | 6% | 9% | 8% | 9% |
| Nominated for or winner of a literary award | 6% | 6% | 6% | 8% |
| Large print or preferred format is available | 8% | 6% | 8% | 8% |
The most popular app used by Canadian ebook readers to access and read ebooks in 2025 was Amazon Kindle at 31%. The next most popular was an internet browser at 25% — Google Books (22%), Kobo (16%), and Apple Books (14%) were also popular.
| 2022 | 2023 | 2024 | 2025 | |
|---|---|---|---|---|
| Amazon Kindle | 29% | 34% | 35% | 31% |
| Internet browser (e.g., Safari, Firefox, Chrome, IE, Edge, etc.) | 26% | 23% | 23% | 25% |
| Google Books | 19% | 22% | 21% | 22% |
| Kobo | 15% | 15% | 11% | 16% |
| Apple Books | 16% | 16% | 16% | 14% |
| OverDrive/Libby | 10% | 10% | 11% | 11% |
| Adobe Reader or Digital Editions | 11% | 12% | 12% | 11% |
| Hoopla | 5% | 5% | 6% | 6% |
| CloudLibrary | 7% | 7% | 8% | 6% |
| Barnes & Noble Nook | 3% | 2% | 5% | 5% |
| Scribd | 4% | 6% | 7% | 4% |
| Aldiko | 3% | 4% | 3% | 4% |
| Moon+ Reader | 4% | 3% | 3% | 4% |
To read their ebooks, Canadian ebook readers have decreasingly used a tablet and increasingly used their smartphones since 2025. A total of 30% of ebook readers read on a tablet in 2025, down from 32% in 2022. Use of dedicated e-readers has also been increasing since 2022 — 15% read ebooks on a dedicated e-reader in 2025, up from 13% in 2022.
| 2022 | 2023 | 2024 | 2025 | |
|---|---|---|---|---|
| Smartphone | 34% | 36% | 38% | 36% |
| Tablet (e.g., iPad, Surface, Galaxy, Kindle Fire, Kobo Arc, etc.) | 32% | 28% | 28% | 30% |
| Computer | 19% | 18% | 15% | 17% |
| Dedicated e-reader (e.g., Kobo, Kindle, Sony, Nook, etc.) | 13% | 14% | 16% | 15% |
| Braille display/terminal | 1% | 2% | 1% | 2% |
| Other | 2% | 2% | 2% | 1% |
Ebook features and reading behaviours
Canadian ebook readers used a wide variety of features in their ebooks in 2025. Many ebook readers used or sometimes used:
- I adjust font size or spacing to increase the text size or space out letters/lines — 75%
- The table of contents — 73%
- The night display when reading in dim/low lighting — 71%
- The screen magnification or zoom — 70%
| Yes | Sometimes | No | Unsure / N/A | Yes and sometimes | |
|---|---|---|---|---|---|
| I adjust font size or spacing to increase the text size or space out letters/lines. | 34% | 42% | 23% | 2% | 75% |
| I use the table of contents. | 33% | 40% | 24% | 3% | 73% |
| I turn on the night display when reading in dim/low lighting. | 37% | 35% | 24% | 5% | 71% |
| I adjust the screen magnification/zoom to be larger. | 30% | 40% | 28% | 3% | 70% |
| I use the Bookmark button. | 29% | 38% | 28% | 5% | 67% |
| I use the reading mode on a tablet or smartphone. | 33% | 34% | 28% | 6% | 66% |
| I change text or background colour(s) for a brighter contrast. | 25% | 40% | 31% | 4% | 65% |
| I use the search function. | 27% | 36% | 33% | 4% | 63% |
| I don’t know how to use most or all of these features. | 24% | 32% | 39% | 4% | 57% |
| I change the text orientation from portrait to landscape. | 21% | 34% | 41% | 4% | 55% |
| I use reference page numbers or the percentage metric. | 24% | 31% | 39% | 6% | 55% |
| I make notes or highlight text. | 21% | 32% | 45% | 3% | 53% |
| I turn on the screen reader to use the text-to-speech feature or a Braille device. | 18% | 25% | 53% | 4% | 43% |
| I use voice control, eye tracking, or switches. | 16% | 24% | 56% | 4% | 40% |
When reading ebooks, over half of all Canadian ebook readers in 2025 agreed or sometimes agreed that they took the actions in the table below.
| Yes | Sometimes | No | Unsure / N/A | Yes and sometimes | |
|---|---|---|---|---|---|
| I read while doing something else (listening to music, watching TV, etc.) | 26% | 31% | 39% | 4% | 57% |
| I delete the ebook from my personal library after I finish reading it. | 26% | 31% | 37% | 6% | 57% |
| I skim or speed read. | 19% | 36% | 42% | 2% | 55% |
| I prefer ebooks with embedded audio or embedded video. | 22% | 31% | 36% | 11% | 53% |
When reading, ebook readers are more likely than all Canadian readers to agree or sometimes agree that they only read sections of a book that interest them (59% of ebook readers vs. 54% of all readers). They are equally likely as all Canadians to agree or sometimes agree that they stop reading a book if they don’t like it (81% of ebook readers and 80% of all readers).
The same as all Canadian readers (37%), Canadian ebook readers searched for other books by the same author they were reading (38%). More than all Canadian readers, ebook readers:
- Shared the experience, book, or photo of the book with others — 25% of ebook readers vs. 23% of all readers.
- Went online to read about the author or follow them on social media — 25% of ebook readers vs. 21% of all readers.
- Added the book to a list of books they were currently reading or finished reading — 23% of ebook readers vs. 20% of all readers.
Ebook subjects
Most ebook readers read either Adult Fiction (70%) or Non-Fiction (50%) ebooks, with others reading Young Adult (15%) and Children’s (10%) ebooks.
The most popular Adult Fiction ebook subjects in 2025 were:
- Mystery or Thriller — 48%;
- Romance — 36%;
- Fantasy — 31%;
- Science Fiction — 28%; and
- Historical Fiction — 28%.
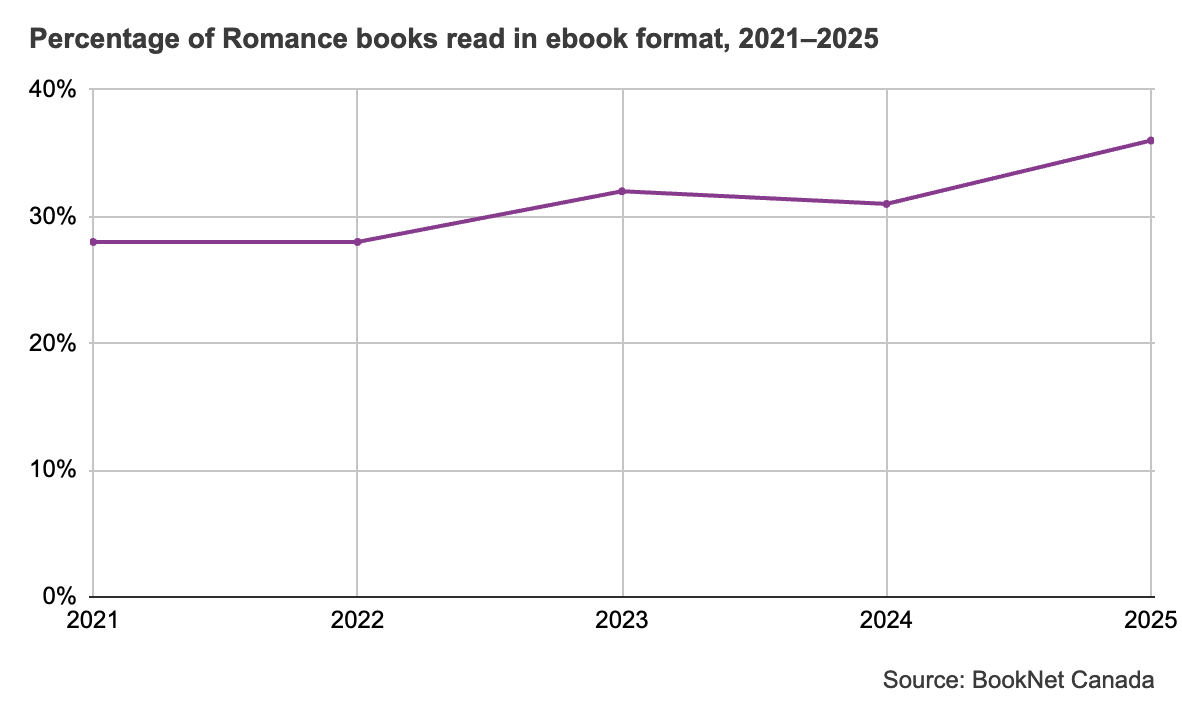
Reading Romance in ebook format has been trending up. As we can see in the graph below, in 2021, 28% of ebook readers read Romance which has steadily climbed to 36% in 2025.
Find our source data here.
The most popular ebook Non-Fiction titles for Canadian ebook readers in 2025 were:
- History — 38%;
- True Crime — 33%;
- Biography or Autobiography — 28%; and
- Self-Help — 26%.
Overall, Canadian ebook readers read more broadly than all Canadian readers. In 2025, ebook readers read:
- Books that were made into movies or TV shows — 49% of ebook readers vs. 44% of all readers
- Books that had a sequel (duology, trilogy, series, etc.) — 40% of ebook readers vs. 37% of all readers
- Comics, manga, or graphic novels — 27% of ebook readers vs. 23% of all readers
- Books in a language other than English (including multilingual books) — 22% of ebook readers vs. 17% of all readers
- Poetry, books in verse, or plays — 21% of ebook readers vs. 16% of all readers
- Controversial books or books that have been banned elsewhere — 19% of ebook readers vs. 15% of all readers
The most popular languages that Canadian ebook readers were reading in 2025, other than English, were French (39%) and Spanish (12%).
Canadian ebook readers also read books that were by or about:
- Canadians/locals — 39% of ebook readers vs. 35% of all readers
- Black, Indigenous, or person/people of colour — 22% of ebook readers vs. 18% of all readers
- LGBTQIA+ people (lesbian, gay, bisexual, trans, queer, intersex, asexual, aromantic, non-binary, etc.) — 12% of ebook readers vs. 10% of all readers
- People with immigrant status — 12% of ebook readers vs. 13% of all readers
- People with a disability (physical, mental, or emotional activity impairment/limitation temporarily, episodically, or permanently, etc.) — 14% of ebook readers vs. 11% of all readers
- People who belong to religious minorities (Muslim, Hindu, Sikh, Buddhist, Jewish, etc.) — 16% of ebook readers vs. 13% of all readers
These ebook readers were also slightly more likely than all Canadian readers to agree or sometimes agree that:
- Books should be representative of a variety of experiences — 91% of ebook readers vs. 90% of all readers.
- It is important that books about a group or culture should be written by people from that group or culture — 74% of ebook readers vs. 71% of all readers.
- It is important that authors accurately represent their material through research, fact-checking, and/or hiring reviewers and sensitivity or beta readers — 89% of ebook readers vs. 88% of all readers.
About BookNet Canada
BookNet Canada is a non-profit organization that develops technology, standards, and education to serve the Canadian book industry. Founded in 2002 to address systemic challenges in the industry, BookNet Canada supports publishing companies, booksellers, wholesalers, distributors, sales agents, and libraries across the country. Industry-led and partially funded by the Department of Canadian Heritage, BookNet Canada has become, as The Globe and Mail puts it, “the book industry’s supply-chain nerve centre.”
BookNet Canada acknowledges that its operations are remote and our colleagues contribute their work from the traditional territories of the Mississaugas of the Credit, the Anishinaabe, the Haudenosaunee, the Wyandot, the Mi’kmaq, the Ojibwa of Fort William First Nation, the Three Fires Confederacy of First Nations (which includes the Ojibwa, the Odawa, and the Potawatomie), the Métis, as well as the unceded and ancestral territory of the Musqueam, Squamish, or Tsleil-Waututh peoples, the original nations and peoples of the lands we now call Beeton, Guelph, Halifax, Thunder Bay, Toronto, Vancouver, Vaughan, and Windsor. We endorse the Calls to Action from the Truth and Reconciliation Commission of Canada and support an ongoing shift from gatekeeping to spacemaking in the book industry.
The book industry has long been an industry of gatekeeping. Anyone who works at any stage of the book supply chain carries a responsibility to serve readers by publishing, promoting, and supplying works that represent the wide extent of human experiences and identities in all that complicated intersectionality. BookNet is committed to working with our partners in the industry as we move towards a framework that supports “spacemaking,” which ensures that marginalized creators and professionals all have the opportunity to contribute, work, and lead.
BookNet Canada’s services and research help companies promote and sell books, streamline workflows, and analyze and adapt to a rapidly changing market. BookNet Canada sets technology standards and educates organizations about how to apply them, performs market research, and tracks 85% of all Canadian English-language print trade book sales through BNC SalesData.
BookNet Canada has extensive research available on our website, both free and for purchase.
- The Canadian Book Market 2025 (Paid) is our annual comprehensive report on the Canadian market. Contains detailed information on more than 50 subject categories, including market share, weekly unit sales, average selling price, top 10 hardcover and paperback sellers, and public library lending information.
- Canadian Book Consumer Study 2025 compiles the results from our biannual surveying of Canadians about their book buying and reading habits in 2025.
- Canadian Leisure & Reading Study 2025 looks at how Canadians are spending their leisure time and the behaviours of Canadian readers in 2025.
To stay updated on current and future research, subscribe to our monthly Research newsletter. To stay up-to-date on all BookNet Canada news and information, subscribe to our weekly eNews.
If you have any questions or comments about this or other studies, please contact the research team at research@booknetcanada.ca.
Learn more at booknetcanada.ca.
Appendix A: Demographics of Canadian ebook buyers from the Canadian Book Consumer Study 2025
| Ebook buyers | All buyers | All Canadians | |
|---|---|---|---|
| Male | 53% | 49% | 47% |
| Female | 46% | 50% | 52% |
| Non-binary | 0% | 1% | 0% |
| Prefer not to say | 0% | 0% | 0% |
| Ebook buyers | All buyers | All Canadians | |
|---|---|---|---|
| 18-24 | 9% | 6% | 4% |
| 25-34 | 26% | 15% | 11% |
| 35-44 | 24% | 17% | 14% |
| 45-54 | 19% | 16% | 16% |
| 55-64 | 12% | 16% | 21% |
| 65+ | 10% | 31% | 35% |
| Ebook buyers | All buyers | All Canadians | |
|---|---|---|---|
| Atlantic | 6% | 8% | 7% |
| Central | 59% | 56% | 55% |
| Prairies | 21% | 22% | 22% |
| West Coast & Northern Territories | 14% | 14% | 15% |
| Ebook buyers | All buyers | All Canadians | |
|---|---|---|---|
| City or urban area | 61% | 53% | 48% |
| Suburban area | 32% | 37% | 37% |
| Small town or rural area | 7% | 11% | 15% |
| Ebook buyers | All buyers | All Canadians | |
|---|---|---|---|
| Less than highschool | 1% | 1% | 2% |
| Highschool graduate or equivalent | 10% | 13% | 18% |
| Some post secondary education, not completed | 9% | 9% | 10% |
| College or university degree/diploma | 50% | 52% | 51% |
| Graduate or professional degree | 30% | 25% | 18% |
| Prefer not to say | 0% | 0% | 0% |
| Other | 1% | 0% | 1% |
| Ebook buyers | All buyers | All Canadians | |
|---|---|---|---|
| Employed full time | 62% | 51% | 39% |
| Employed part time | 7% | 9% | 8% |
| Self employed | 6% | 7% | 6% |
| Not employed | 6% | 5% | 6% |
| Retired | 13% | 22% | 34% |
| Student | 2% | 3% | 2% |
| Homemaker | 2% | 4% | 3% |
| Prefer not to say | 0% | 0% | 0% |
| Other | 2% | 1% | 1% |
| Ebook buyers | All buyers | All Canadians | |
|---|---|---|---|
| Single (never married) | 38% | 23% | 27% |
| Living with partner | 8% | 7% | 8% |
| Married | 46% | 48% | 48% |
| Seperated | 1% | 1% | 2% |
| Divorced | 5% | 6% | 8% |
| Widowed | 2% | 4% | 6% |
| Other | 0% | 0% | 0% |
| Prefer not to say | 0% | 0% | 0% |
| Ebook buyers | All buyers | All Canadians | |
|---|---|---|---|
| One – myself | 20% | 22% | 25% |
| Two | 25% | 32% | 39% |
| Three | 21% | 21% | 17% |
| Four | 19% | 16% | 12% |
| Five | 11% | 6% | 4% |
| Six | 3% | 2% | 1% |
| Seven | 1% | 1% | 1% |
| Eight | 0% | 0% | 0% |
| Nine | 0% | 0% | 0% |
| Ten or more | 0% | 0% | 0% |
| Ebook buyers | All buyers | All Canadians | |
|---|---|---|---|
| Under 3 years of age | 8% | 4% | 3% |
| 3-5 years of age | 15% | 8% | 5% |
| 6-8 years of age | 9% | 8% | 5% |
| 9-10 years of age | 8% | 5% | 3% |
| 11-12 years of age | 7% | 5% | 4% |
| 13-17 years of age | 20% | 17% | 13% |
| None under 18 years of age | 37% | 46% | 57% |
| Ebook buyers | All buyers | All Canadians | |
|---|---|---|---|
| Under $15,000 | 4% | 3% | 4% |
| $15,000-$24,999 | 2% | 2% | 5% |
| $25,000-$34,999 | 9% | 9% | 10% |
| $35,000-$49,999 | 9% | 9% | 12% |
| $50,000-$74,999 | 17% | 19% | 21% |
| $75,000-$99,999 | 20% | 19% | 17% |
| $100,000-$149,999 | 20% | 20% | 17% |
| $150,000 and over | 17% | 17% | 12% |
| Prefer not to say | 1% | 2% | 2% |
| Other | 0% | 1% | 1% |
| Ebook buyers | All buyers | All Canadians | |
|---|---|---|---|
| Class (working class, low income, etc.) | 17% | 14% | 15% |
| Religion (Muslim, Hindu, Sikh, Buddhist, Jewish, etc.) | 12% | 9% | 8% |
| Blackness | 7% | 5% | 4% |
| Indigeneity | 2% | 2% | 2% |
| People of colour | 17% | 14% | 11% |
| Gender (trans, queer, 2-Spirited, non-binary, etc.) | 3% | 3% | 2% |
| Sexuality (lesbian, gay, bisexual, queer, asexual, aromantic, etc.) | 11% | 8% | 6% |
| Disability (physical, mental, or emotional activity impairment/limitation temporarily, episodically, or permanently, etc.) | 13% | 10% | 12% |
| Neurodiversity | 7% | 5% | 3% |
| Family structure/single | 8% | 9% | 9% |
| Age (young, senior) | 15% | 22% | 28% |
| Language (English is not the first language) | 11% | 9% | 8% |
| Other | 1% | 1% | 1% |
| Prefer not to say | 2% | 1% | 2% |
| None | 33% | 38% | 38% |
Appendix B: Demographics of Canadian ebook borrowers from the Canadian Book Consumer Study 2025
| Ebook borrowers | All borrowers | All Canadians | |
|---|---|---|---|
| Male | 33% | 39% | 47% |
| Female | 67% | 61% | 52% |
| Non-binary | 1% | 0% | 0% |
| Prefer not to say | 0% | 0% | 0% |
| Ebook borrowers | All borrowers | All Canadians | |
|---|---|---|---|
| 18-24 | 6% | 6% | 4% |
| 25-34 | 18% | 15% | 11% |
| 35-44 | 18% | 17% | 14% |
| 45-54 | 20% | 16% | 16% |
| 55-64 | 15% | 16% | 21% |
| 65+ | 24% | 31% | 35% |
| Ebook borrowers | All borrowers | All Canadians | |
|---|---|---|---|
| Atlantic | 4% | 5% | 7% |
| Central | 60% | 58% | 55% |
| Prairies | 22% | 22% | 22% |
| West Coast & Northern Territories | 14% | 14% | 15% |
| Ebook borrowers | All borrowers | All Canadians | |
|---|---|---|---|
| City or urban area | 67% | 54% | 48% |
| Suburban area | 28% | 36% | 37% |
| Small town or rural area | 5% | 10% | 15% |
| Ebook borrowers | All borrowers | All Canadians | |
|---|---|---|---|
| Less than highschool | 1% | 1% | 2% |
| Highschool graduate or equivalent | 8% | 11% | 18% |
| Some post secondary education, not completed | 7% | 6% | 10% |
| College or university degree/diploma | 59% | 58% | 51% |
| Graduate or professional degree | 24% | 22% | 18% |
| Prefer not to say | 0% | 0% | 0% |
| Other | 1% | 1% | 1% |
| Ebook borrowers | All borrowers | All Canadians | |
|---|---|---|---|
| Employed full time | 46% | 45% | 39% |
| Employed part time | 7% | 9% | 8% |
| Self employed | 7% | 6% | 6% |
| Not employed | 8% | 6% | 6% |
| Retired | 22% | 27% | 34% |
| Student | 1% | 2% | 2% |
| Homemaker | 5% | 3% | 3% |
| Prefer not to say | 1% | 1% | 0% |
| Other | 3% | 2% | 1% |
| Ebook borrowers | All borrowers | All Canadians | |
|---|---|---|---|
| Single (never married) | 27% | 26% | 27% |
| Living with partner | 8% | 8% | 8% |
| Married | 49% | 49% | 48% |
| Seperated | 1% | 2% | 2% |
| Divorced | 10% | 9% | 8% |
| Widowed | 4% | 5% | 6% |
| Other | 1% | 0% | 0% |
| Prefer not to say | 0% | 0% | 0% |
| Ebook borrowers | All borrowers | All Canadians | |
|---|---|---|---|
| One – myself | 20% | 24% | 25% |
| Two | 33% | 30% | 39% |
| Three | 19% | 21% | 17% |
| Four | 13% | 15% | 12% |
| Five | 10% | 6% | 4% |
| Six | 1% | 2% | 1% |
| Seven | 3% | 2% | 1% |
| Eight | 0% | 0% | 0% |
| Nine | 0% | 0% | 0% |
| Ten or more | 0% | 0% | 0% |
| Ebook borrowers | All borrowers | All Canadians | |
|---|---|---|---|
| Under 3 years of age | 3% | 5% | 3% |
| 3-5 years of age | 11% | 10% | 5% |
| 6-8 years of age | 4% | 9% | 5% |
| 9-10 years of age | 4% | 5% | 3% |
| 11-12 years of age | 3% | 5% | 4% |
| 13-17 years of age | 21% | 22% | 13% |
| None under 18 years of age | 45% | 59% | 57% |
| Ebook borrowers | All borrowers | All Canadians | |
|---|---|---|---|
| Under $15,000 | 6% | 3% | 4% |
| $15,000-$24,999 | 2% | 3% | 5% |
| $25,000-$34,999 | 11% | 10% | 10% |
| $35,000-$49,999 | 13% | 10% | 12% |
| $50,000-$74,999 | 16% | 17% | 21% |
| $75,000-$99,999 | 14% | 18% | 17% |
| $100,000-$149,999 | 19% | 21% | 17% |
| $150,000 and over | 16% | 15% | 12% |
| Prefer not to say | 1% | 2% | 2% |
| Other | 1% | 2% | 1% |
| Ebook borrowers | All borrowers | All Canadians | |
|---|---|---|---|
| Class (working class, low income, etc.) | 15% | 15% | 15% |
| Religion (Muslim, Hindu, Sikh, Buddhist, Jewish, etc.) | 10% | 10% | 8% |
| Blackness | 7% | 5% | 4% |
| Indigeneity | 3% | 2% | 2% |
| People of colour | 16% | 16% | 11% |
| Gender (trans, queer, 2-Spirited, non-binary, etc.) | 1% | 2% | 2% |
| Sexuality (lesbian, gay, bisexual, queer, asexual, aromantic, etc.) | 11% | 9% | 6% |
| Disability (physical, mental, or emotional activity impairment/limitation temporarily, episodically, or permanently, etc.) | 12% | 12% | 12% |
| Neurodiversity | 7% | 5% | 3% |
| Family structure/single | 10% | 9% | 9% |
| Age (young, senior) | 24% | 26% | 28% |
| Language (English is not the first language) | 6% | 9% | 8% |
| Other | 1% | 1% | 1% |
| Prefer not to say | 1% | 2% | 2% |
| None | 33% | 34% | 38% |
Appendix C: Demographics of Canadian ebook readers from the Canadian Leisure & Reading Study 2025
| Ebook readers | All readers | |
|---|---|---|
| Woman | 50% | 51% |
| Man | 49% | 48% |
| Non-binary or gender non-conforming | 1% | 0% |
| Prefer not to say | 0% | 0% |
| Ebook readers | All readers | |
|---|---|---|
| 18-29 | 26% | 21% |
| 30-44 | 28% | 26% |
| 45-54 | 19% | 17% |
| 55-64 | 13% | 16% |
| 65+ | 14% | 19% |
| Ebook readers | All readers | |
|---|---|---|
| Atlantic | 8% | 8% |
| Central | 53% | 52% |
| Prairies | 23% | 24% |
| West Coast & Northern Territories | 16% | 16% |
| Ebook readers | All readers | |
|---|---|---|
| City or urban area | 51% | 49% |
| Suburban area | 34% | 35% |
| Small town or rural area | 15% | 16% |
| Ebook readers | All readers | |
|---|---|---|
| College or university | 53% | 52% |
| Graduate or professional | 17% | 15% |
| High school or GED | 31% | 32% |
| Apprenticeship | 3% | 3% |
| Trade school | 7% | 8% |
| Prefer not to say / Other | 1% | 1% |
| Ebook readers | All readers | |
|---|---|---|
| A parent/elder | 12% | 10% |
| A child/young adult | 28% | 24% |
| Someone / a relationship not listed | 7% | 6% |
| None | 58% | 41% |
| Ebook readers | All readers | |
|---|---|---|
| Under $15,000 | 5% | 5% |
| $15,000-$24,999 | 8% | 9% |
| $25,000-$34,999 | 12% | 11% |
| $35,000-$49,999 | 10% | 11% |
| $50,000-$74,999 | 20% | 20% |
| $75,000-$99,999 | 18% | 18% |
| $100,000-$149,999 | 17% | 16% |
| $150,000 and over | 8% | 8% |
| Prefer not to say | 3% | 3% |
| Ebook readers | All readers | |
|---|---|---|
| BIPOC | 9% | 8% |
| Disabled | 13% | 13% |
| LGBTQIA+ | 8% | 7% |
| Working class / low income earner | 21% | 21% |
| Immigrant | 17% | 14% |
| Religious minority | 10% | 8% |
| Prefer not to say | 3% | 3% |
| None | 42% | 45% |
Related studies
-
Scrolling stories: Ebook use in Canada 2025
Insights into ebook use in Canada, including the buying, borrowing, and reading habits of Canadian ebook consumers.
-
Tapping into Ebooks: Ebook use in Canada 2022
This free study benchmarks ebook use in Canada, and reveals the buying, borrowing, and reading habits of Canadian ebook consumers.
-
Measuring Attitudes and Adoption of Digital Content for Kids and Teens
The survey examines attitudes around book buying and reading, specifically: reading habits, and attitudes and behaviour around the use of ebooks and apps.