
Canadian Leisure & Reading Study 2025

This free report looks at how Canadians are spending their leisure time and the behaviours of Canadian readers in 2025.
Using data from BookNet Canada's survey of 1,278 adult, English-speaking Canadians, it asks in-depth questions about Canadians’ leisure activities, with a particular focus on how readers and non-readers spend their free time, how readers discover and acquire their books, readers' format preferences, popular Fiction and Non-Fiction genres, the value of books across formats, and more.
You can find last year’s report here.
Table of Contents
- Introduction
- Highlights
- Canadians and their free time
- Readers and their leisure activities
- Reading as a leisure activity
- Book discovery
- Acquisition by format
- Money spent on books and perception of value
- Format preferences and frequency of reading
- Reading behaviours and preferences
- Reading devices and apps
- Accessibility and reading features
- Subjects and types of books
- Diversity and representation in books
- About BookNet Canada
- Appendix A: Canadian Leisure & Reading 2025 survey
- Appendix B: Demographics
Introduction
Now in its thirteenth edition, the annual Canadian Leisure and Reading survey provides insight into the reading behaviours of Canadians in the previous year as well as over time when compared to previous surveys. This information can guide data-driven decisions in the Canadian book industry and beyond.
Methodology
This survey was fielded in January 2026 to 1,278 Canadians over the age of 18 (demographics in Appendix B). We surveyed Canadians until we had responses from 1,005 people who had read at least one book in 2025.
- Readers refers to the 1,005 respondents who had read or listened to a book or part of a book at least once in the past year.
- Buying refers to purchasing books from either an online retailer (or retailing app for ebooks and audiobooks), a physical bookstore that primarily sells new books, a used bookstore or thrift store, a general retailer, or a subscription service.
Survey methodology:
- The survey was fielded online through an external provider, to their consumer panel of nearly two million Canadians. The survey was limited to those with internet access who were able and wanted to participate in our panel in exchange for non-monetary incentives as offered by our survey partner (e.g., loyalty reward “point” programs).
- Respondents were English-speaking Canadians, 18 years of age or older, located throughout Canada, and representative of the Canadian population based on age, gender, and geographical region. Selective sampling was based on demographic results from Statistics Canada.
- There is a margin of error of ±3 percentage points at the 95% confidence level, meaning that statistics for this group could fluctuate about 3% in either direction if the survey was fielded to the entire Canadian population.
- In 2026, 273 people were screened out for not having read or listened to a book in 2025.
This study was prepared by BookNet Canada staff.
Canadians and their free time
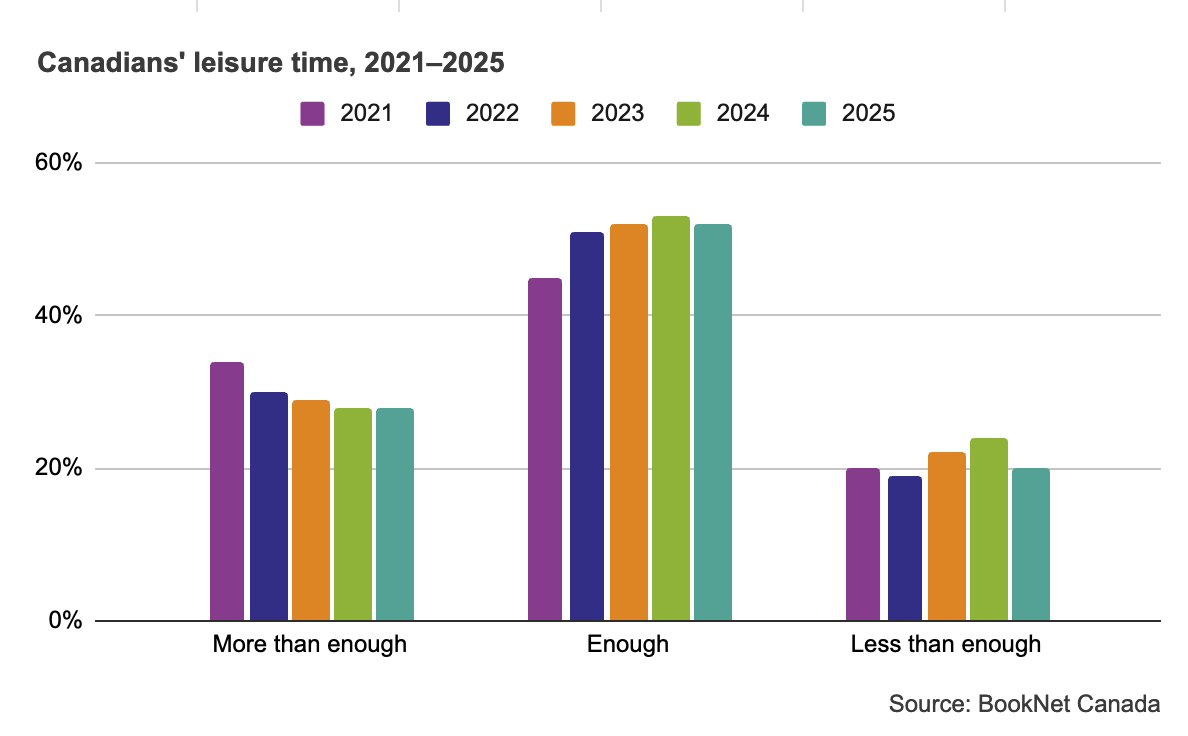
The number of Canadians who say they had more than enough leisure time continues to drop. In 2021, 35% of Canadians reported having more than enough leisure time, but by 2025 this is down to 28%. Over half of Canadians report having enough leisure time for the fourth year running. And while that had been steadily going up, from 45% in 2021, it dropped slightly from 53% in 2024 to 52% in 2025. The percentage of those who felt like they had less than enough leisure time dropped from 24% in 2024 to 20% in 2025.
Find our source data here.
When we asked Canadians about their perception of how much leisure time they had as compared to the previous year, two thirds of Canadians said it had stayed the same (66%). Only 16% said their leisure time had decreased, and 16% said it had increased.
Canadians are using their leisure time in 2025 much the same as they have in past years. The top 10 leisure and recreational activities done by Canadians at least weekly in 2025 were:
- Watching videos/TV/movies (90%)
- Cooking (87%)
- Browsing social media/web (86%)
- Listening to music (84%)
- Spending time with family (71%)
- Shopping (65%)
- Exercising/working out (64%)
- Reading or listening to books (50%)
- Playing video games (47%)
- Listening to radio shows (46%)
Most of these answers were within one or two percentage points of the answers in 2023. However, playing video games jumped up one spot from 41% in 2024 to 47% in 2025. Conversely, listening to radio shows fell from 49% in 2024 to 46% in 2025.
In terms of the activities Canadians do most frequently, here are the top 10 activities Canadians participated in at least once a day in 2025:
- Browsing social media/web (75%)
- Watching videos/TV/movies (75%)
- Cooking (69%)
- Listening to music (65%)
- Spending time with family (47%)
- Exercising/working out (35%)
- Reading or listening to books (31%)
- Playing video games (30%)
- Listening to radio shows (29%)
- Listening to podcasts (21%)
Here as well, video games and listening to radio shows traded spots on the list, when compared with 2024. The remaining order of the list hasn’t changed significantly from 2024.
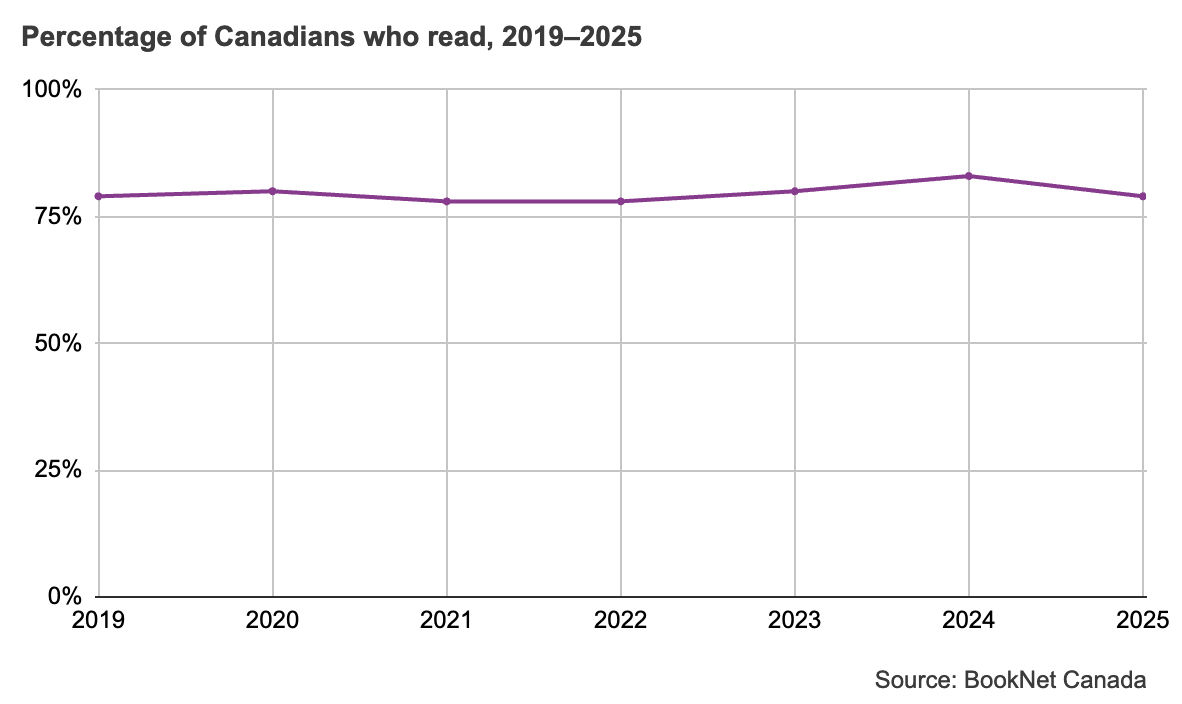
If we drill down to just reading or listening to books, we find that 79% of Canadians chose to use at least some of their leisure time in 2025 with a book — this percentage of readers has been fairly steady over the last several years.
Find our source data here.
Readers and their leisure activities
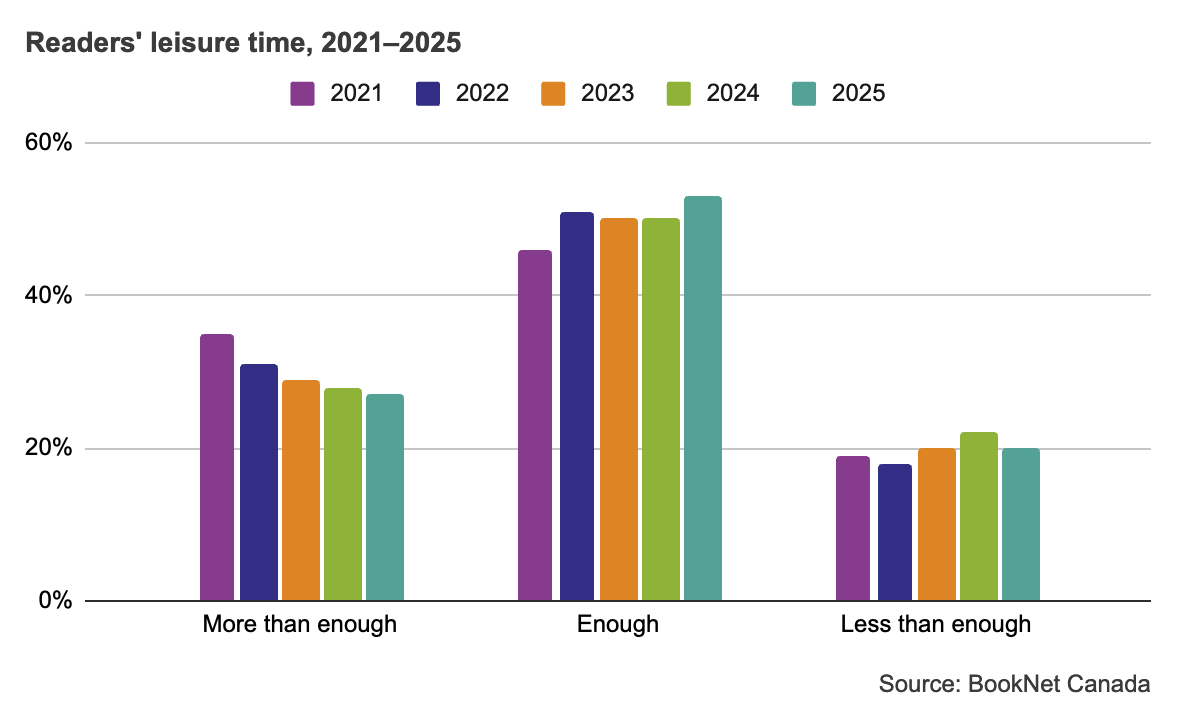
The perception of leisure time for those 79% of Canadians who read a book in 2025 is very similar to the overall Canadian perceptions. Just over half of readers say they had enough leisure time (53%), 27% say they had more than enough, and 20% say less than enough.
Find our source data here.
Readers were less likely to say their leisure time had stayed the same in 2025 as compared with 2024 (64%), but just as likely to say it decreased (16%) and slightly more likely to say it increased (18%) as Canadians overall.
How are readers spending their leisure time? Very similarly to all Canadians. The leisure and recreational activities done by readers weekly in 2025 were:
- Watching videos/TV/movies (90%)
- Cooking (87%)
- Listening to music (87%)
- Browsing social media/web (86%)
- Spending time with family (74%)
- Exercising/working out (69%)
- Shopping (67%)
- Reading or listening to books (63%)
- Playing video games (51%)
- Listening to radio shows (50%)
Leisure and recreational activities done by readers at least once a day in 2025:
- Browsing social media/web (76%)
- Watching videos/TV/movies (75%)
- Cooking (70%)
- Listening to music (67%)
- Spending time with family (49%)
- Reading or listening to books (39%)
- Exercising/working out (37%)
- Playing video games (32%)
- Listening to radio shows (31%)
- Listening to podcasts (24%)
Browsing social media and the web continues to be the top daily activity for readers. However, only 11% of them viewed a book-specific social media post with that same frequency. If we expand the time frame, 23% saw a book-specific social media post at least once a week and half had seen one at least once in 2025 (50%).
Other online activities for readers were visiting a book-specific social network site (e.g., Shelfari, Goodreads, 49th Shelf, Wattpad, FanFiction, Archive of Our Own, etc.) — 48% of readers had done so at least once in 2025, and 22% did so at least weekly.
Reading as a leisure activity
A third of readers prefer reading or listening to books over other leisure activities (30%). Though most sometimes prefer reading to other activities (42%) and a quarter say they don’t mind reading books, but would prefer doing other things instead (24%).
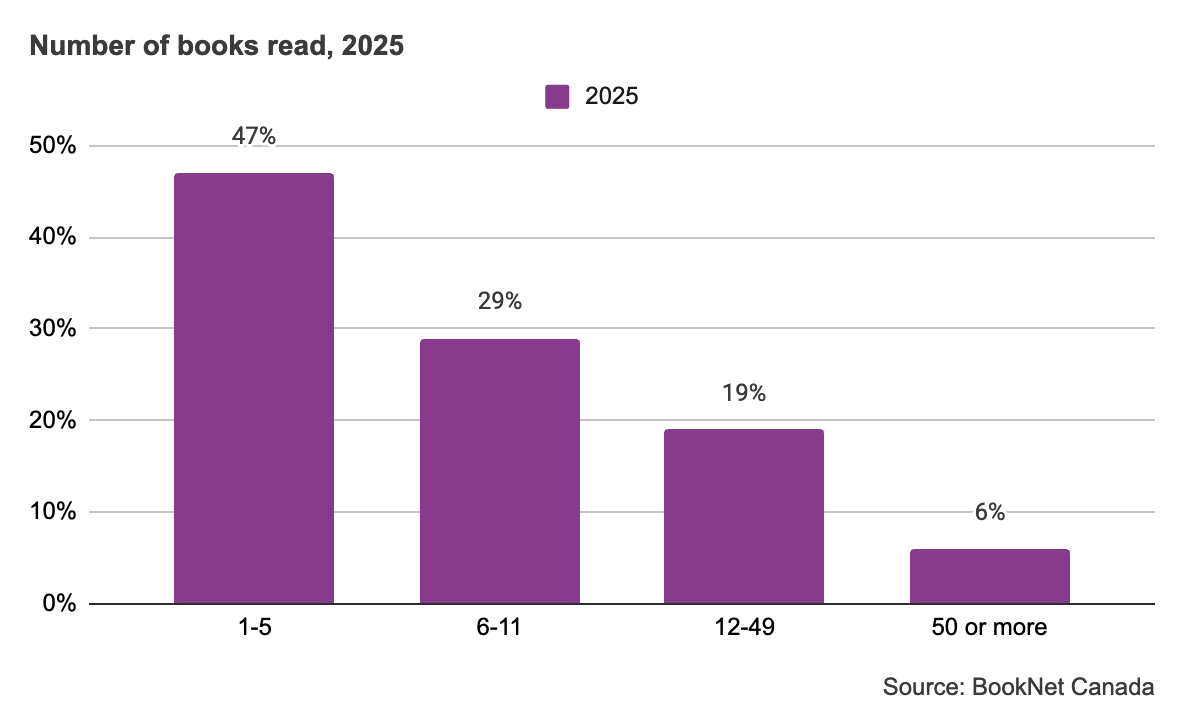
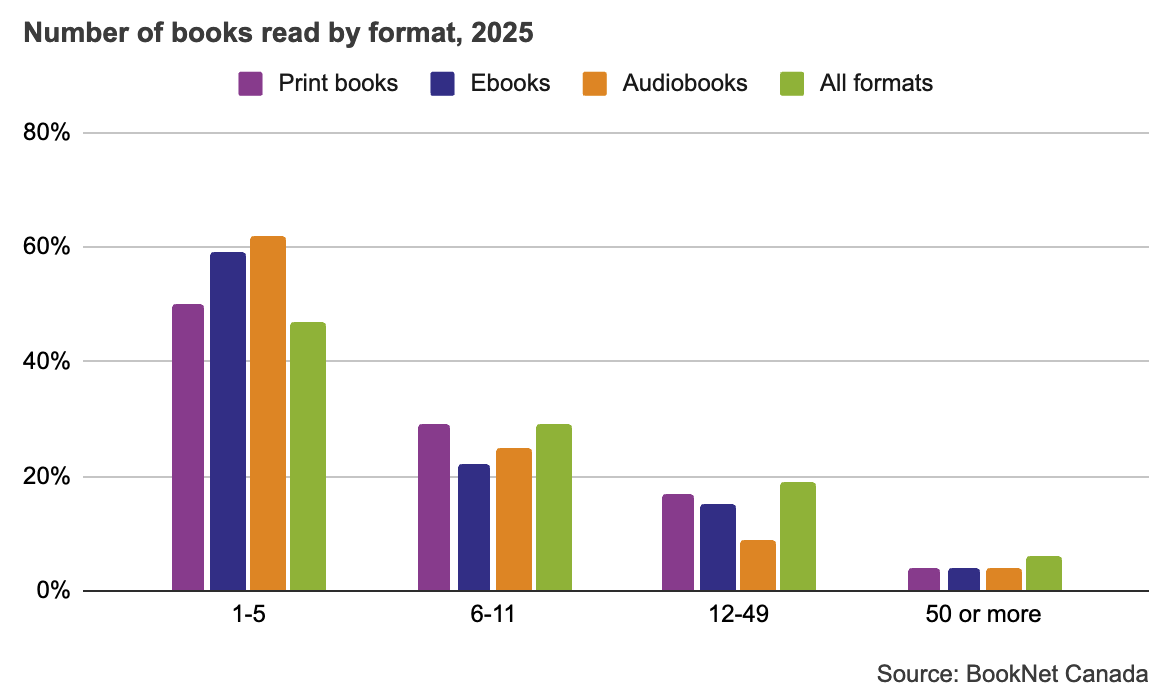
Just under half of all readers read between one and five books in 2025 (47%). Just under a third (29%) read or listened to 6-11 books, and 19% read or listened to 12-49 books. Only 6% read or listened to 50 or more books in 2025. These are all similar to the breakdown in 2024.
Find our source data here.
Readers 65 and over were again the most likely age group to have read 12 or more books in 2025 just as they have been since 2023.
| 18-29 | 30-44 | 45-54 | 55-64 | 65+ | All readers | |
|---|---|---|---|---|---|---|
| 1-5 | 45% | 47% | 53% | 51% | 42% | 47% |
| 6-11 | 37% | 33% | 23% | 26% | 20% | 29% |
| 12-49 | 16% | 15% | 20% | 18% | 27% | 19% |
| 50 or more | 2% | 6% | 4% | 6% | 11% | 6% |
Reasons for reading
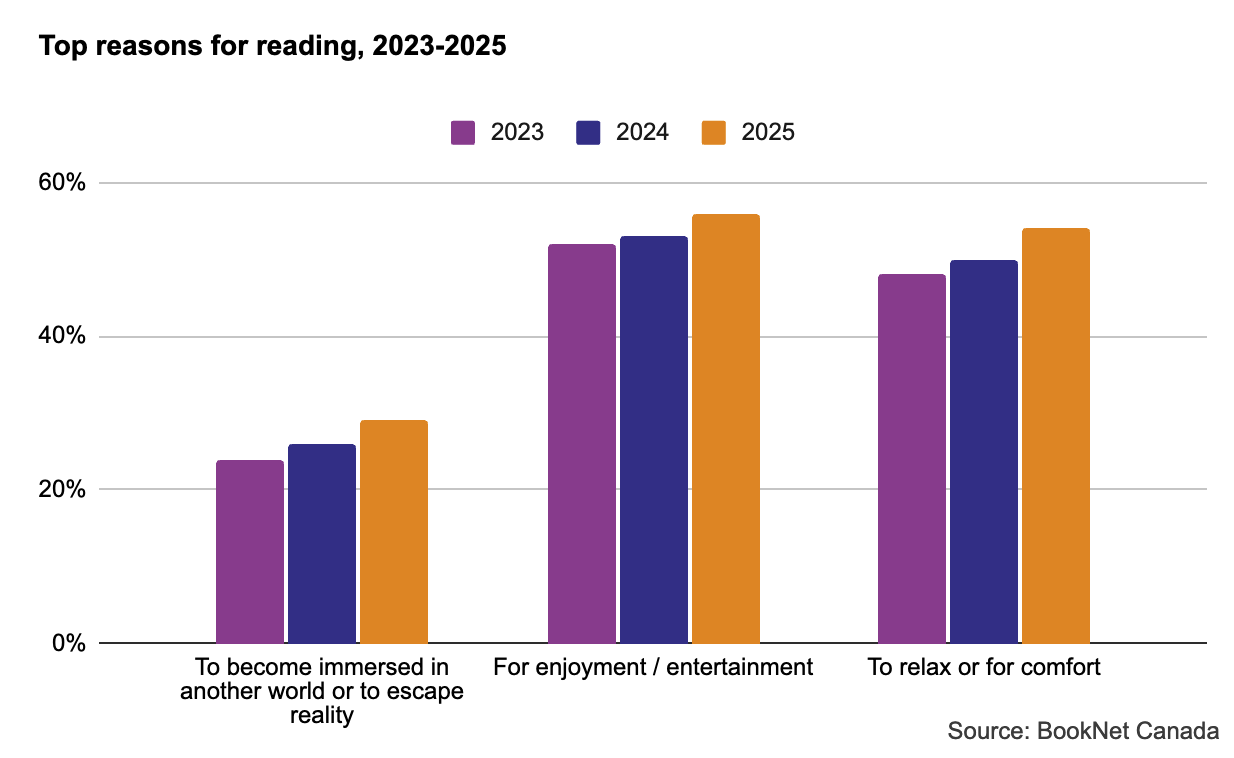
We asked readers to choose the top three reasons why they generally choose to read or listen to books. When we put their responses all together, we found that the top five reasons readers read or listened to books in 2025 were:
- For enjoyment / entertainment (56%)
- To relax or for comfort (54%)
- To become immersed in another world or to escape reality (29%)
- For brain health (improve memory, prevent diseases) (27%)
- To learn things or improve things (for school/study/work or personal) (24%)
The share of readers who are reading to escape, for comfort, or for enjoyment have continued to rise since 2023.
Find our source data here.
Reading activities
Audiobook listeners continue to multi-task while reading; 81% of audiobook listeners say they listened to their books while doing other things (working, commuting/traveling, housework, etc.). A smaller fraction of ebook and print readers also did other activities while reading (listening to music, watching TV, etc.) at least some of the time (57% of ebook readers and 50% of print readers).
In terms of other ways readers engaged with books and their reading, a majority of readers did at least one thing in the list below in 2025 (72%).
- Read all or part of a book aloud to another person (a child, young adult, or adult) (47%)
- Searched for other books by that author (37%)
- Shared the experience, book, or photo of the book with others (23%)
- Went online to read about the author or follow them on social media (21%)
- Added the book to a list of books you were currently reading or finished reading (20%)
- Took an action as a direct result of the book (16%)
- Read or listened to the book in another format (14%)
- Considered the book part of a reading challenge (12%)
The share of readers who attended book-related gatherings in 2025 were much the same as they were in 2024. A third of readers attended an online book club or reading group (34%) or an in-person book club or reading group (34%) at least once in 2025. A third of readers attended at least one book event online in 2025 (33%) and 33% of readers attended an in-person book event (e.g., book launch or reading, award show, festival, presentation, etc.).
Book discovery
Word-of-mouth continues to be the main driver of book discovery, and more readers chose this as one of three main ways they discovered books in 2025 (up from 31% in 2024 to 36% in 2025). Respondents were able to choose up to three main ways they generally discovered their books; the top five answers were:
- Word-of-mouth (including book clubs or reading groups) (36%)
- Bookstore (staff, browsing, displays, newsletter, etc.) (27%)
- Public library (staff, browsing, displays, catalogue, reader list, newsletter, etc.) (26%)
- Social media (TikTok, Facebook, Twitter, Pinterest, Instagram, YouTube, etc.) (23%)
- Online book retailers (Amazon, Chapters, Kobo, Audible, etc.) (18%)
Online book retailers remained in the top five, but the share of readers who chose this option is the lowest it’s been looking back to 2019. It dipped below 20% for the first time in those seven years.
Awards in and of themselves did not drive much book awareness, only 6% of readers chose them as one of the main ways they discovered their books, however, 63% of readers were aware of at least one of the awards listed below in 2025.
Awareness of Canadian literary awards:
- Canada Reads (27%)
- Giller Prize (24%)
- Governor General's Literary Awards (23%)
- The Booksellers' List (16%)
- Canadian Children's Book Centre's CCBC Book Awards (10%)
- Rogers Writers' Trust Fiction Prize (8%)
- Hilary Weston Writers' Trust Prize for Nonfiction (8%)
- Forest of Reading (7%)
- All of the above (3%)
The share of readers who are aware of at least one of the awards in the list above remained unchanged from the previous year, however, the awareness of the Giller Prize and the Governor General’s Literary Awards have been trending down since 2019.
And though readers are aware of awards, only 6% chose awards as one of the top three influences on their decision to read a specific book.
Choosing which books to read
So what does influence Canadian readers when choosing which specific book to read? Well in 2025, the top five reasons readers read the book(s) they did were:
- The subject/topic (41%)
- The author (33%)
- The book’s description (33%)
- Recommendations (23%)
- The main character/series (18%)
So while word-of-mouth drives discovery, a recommendation is not, on its own, enough to convince readers to read a specific book if the subject and book’s description isn’t also appealing.
Canadians have also been choosing to read more books by or about Canadians or locals in 2025 than in the past five years and this has been trending up over that time period, from 28% in 2021 to 35% in 2025.

Find our source data here.
Acquisition by format
For the third year in a row, readers were acquiring books from free sources more than from paid sources. In 2025, 49% of readers bought their print books and 49% found a free source. As for audiobooks and ebooks, readers purchased 39% of their ebooks and 45% of their audiobooks in 2025.
Find our source data here.
Book acquisition from free sources
Readers were most likely to get their ebooks from a free source (59%) and the public library was the top spot (21%), followed by a free internet site (e.g., Project Gutenberg, etc.) (19%), receiving them as a gift (8%), or borrowing from someone they know (7%).
Just over half of audiobooks were acquired for free in 2025 (55%). Readers were most likely to have found them at the public library (22%) or on a free internet site (e.g., LibriVox, YouTube, public domain, etc.) (15%).
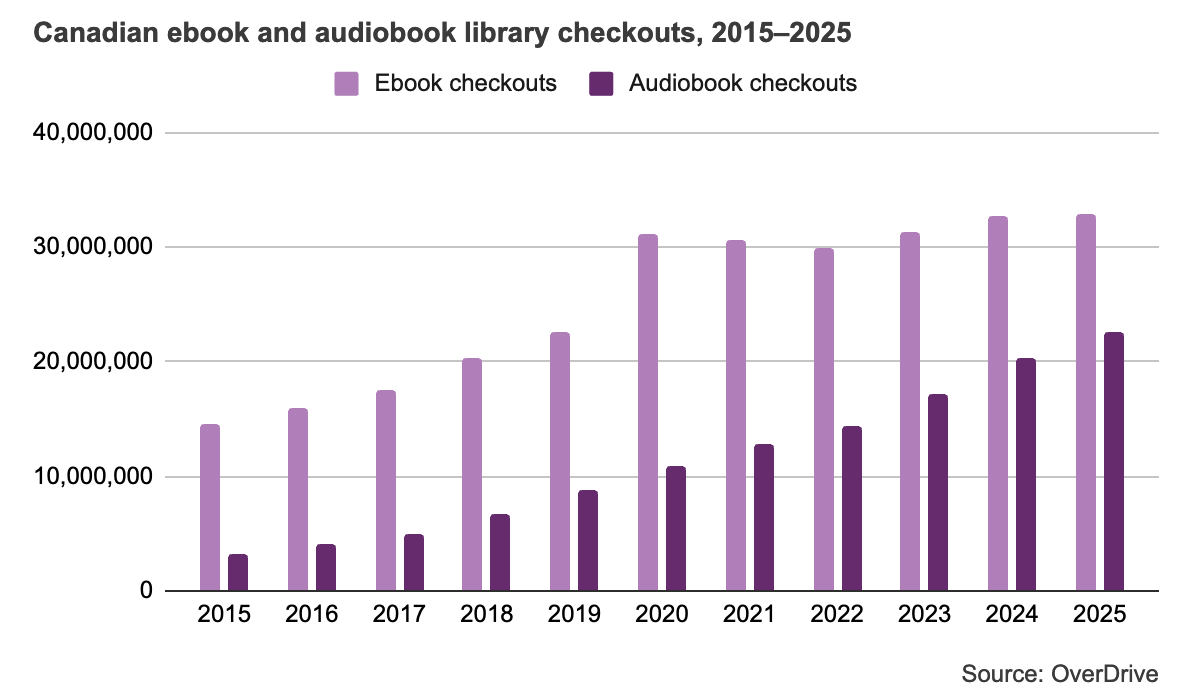
We asked OverDrive, the world’s leading digital reading platform for libraries and schools, for a look at their data to get further insight into ebooks and audiobooks in Canadian libraries. When we look at their data we can see the growth in ebook checkouts seems to have plateaued, but audiobook checkouts continue to increase year over year, a percent change of 11% between 2024 and 2025.
Find our source data here.
Print books were the least likely of all formats to be acquired for free (49%). The public library was the top place, across free and paid sources, for acquiring print books in 2025 at 24%. Receiving a book as a gift (11%), borrowing them from another person (8%), or receiving them for free (e.g., freebie, Free Little Library, ARC, etc.) (7%) were the final three ways that readers acquired their free print books.
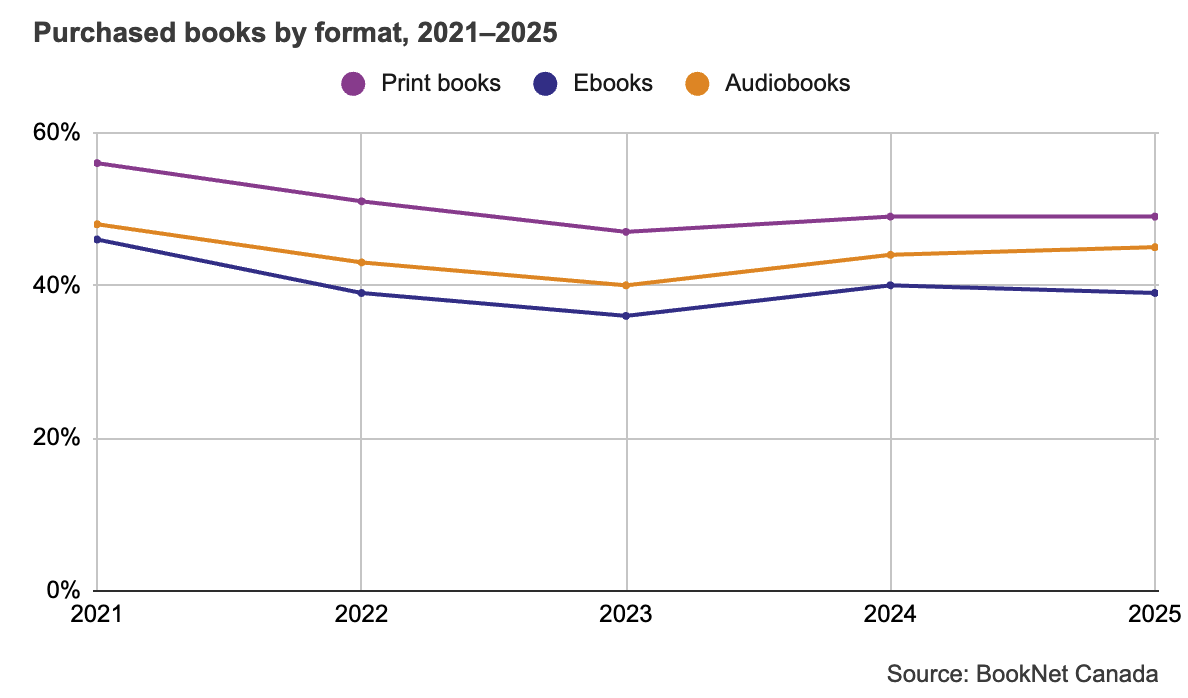
Buying books by format
Print books were the most likely of all formats to be purchased in 2025 (49%). These purchased books were mainly acquired from an online retailer (14%), a physical bookstore that primarily sells new books (13%), or from used bookstores or thrift stores (11%). General retailers (e.g., Costco, Walmart, Shoppers Drug Mart, grocery store, etc.) also accounted for 9% of print book purchases.
The 45% of audiobooks that were purchased were mainly bought from a subscription service (17%), online retailers (e.g., Amazon/Kindle Unlimited, Audiobooks.com, iTunes, etc.) (16%), a general retailer (e.g., Costco, Walmart, Shoppers Drug Mart, grocery store, etc.) (8%), or a physical bookstore (4%).
Ebooks were the least likely format for readers to purchase at 39% in 2025. Ebook purchases were made from an online retailer or via a retailing app (19%), a subscription service (12%), or a general retailer (e.g., Costco, Walmart, Shoppers Drug Mart, grocery store, etc.) (8%).
Money spent on books and perception of value
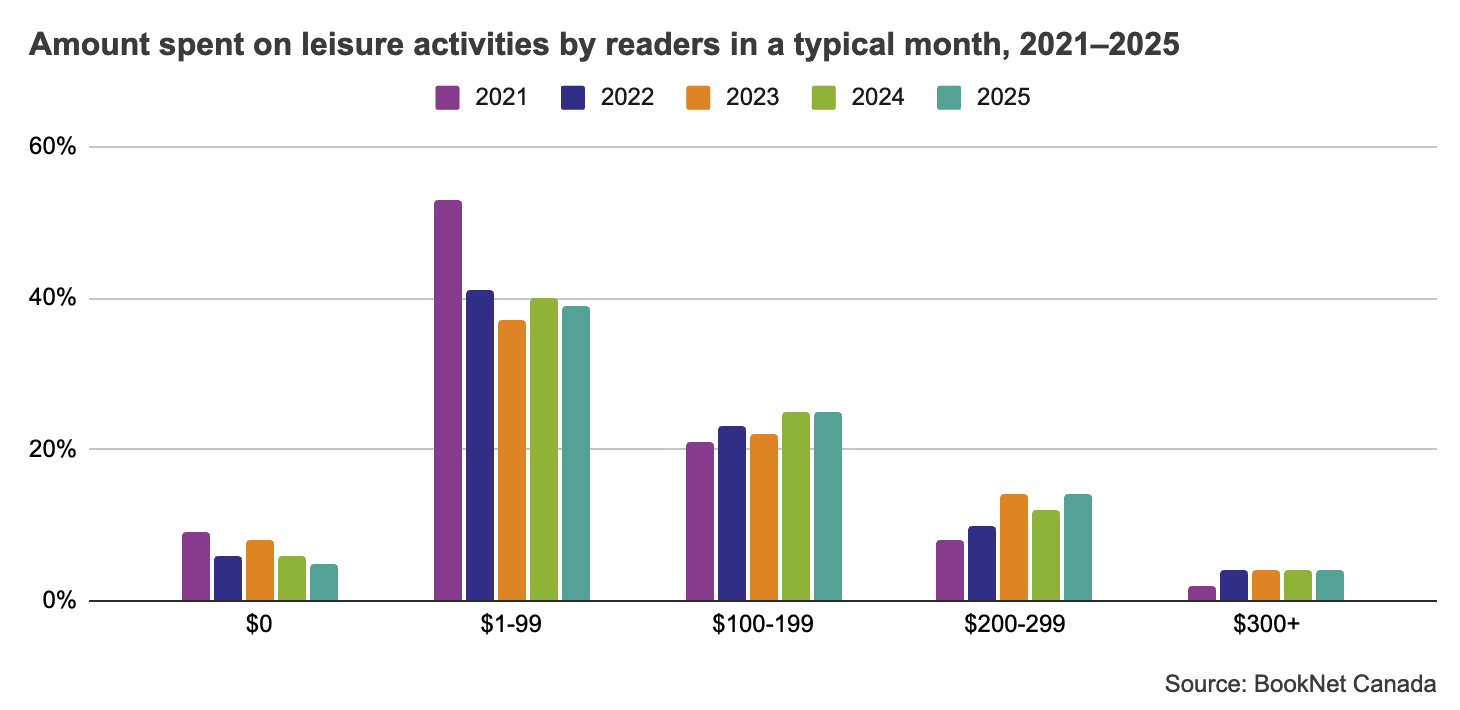
In terms of spending on leisure activities in a given month in 2025, most Canadian readers spent between $1 and $49 (19%) or between $50 and $99 (21%). The third largest share spent between $100 and $149 per month (17%). In 2025, fewer Canadian readers spent $0 in a typical month than they did in 2024 and more spent between $150 and $249.

Find our source data here.
In 2024 we noticed that spending $0 to $99 a month was down at a time when cost of living was rising. In 2025, rising cost of living costs continued to be a concern for Canadians, but interestingly, this does not seem to have had as much of an impact on leisure spending as we might have thought. We can see a downward trend for those spending under $100 between 2021 and 2025 and an upward trend for those spending $100 to $299.
Find our source data here.
When we narrow down leisure spending to just book spending in 2025, we found that more readers are spending nothing on books in a typical month than they did in 2024 (from 26% in 2024 to 28% in 2025). The largest share of readers still spent between $1 and $49 per month on books, but that decreased from 37% in 2024 to 34% in 2025.

Find our source data here.
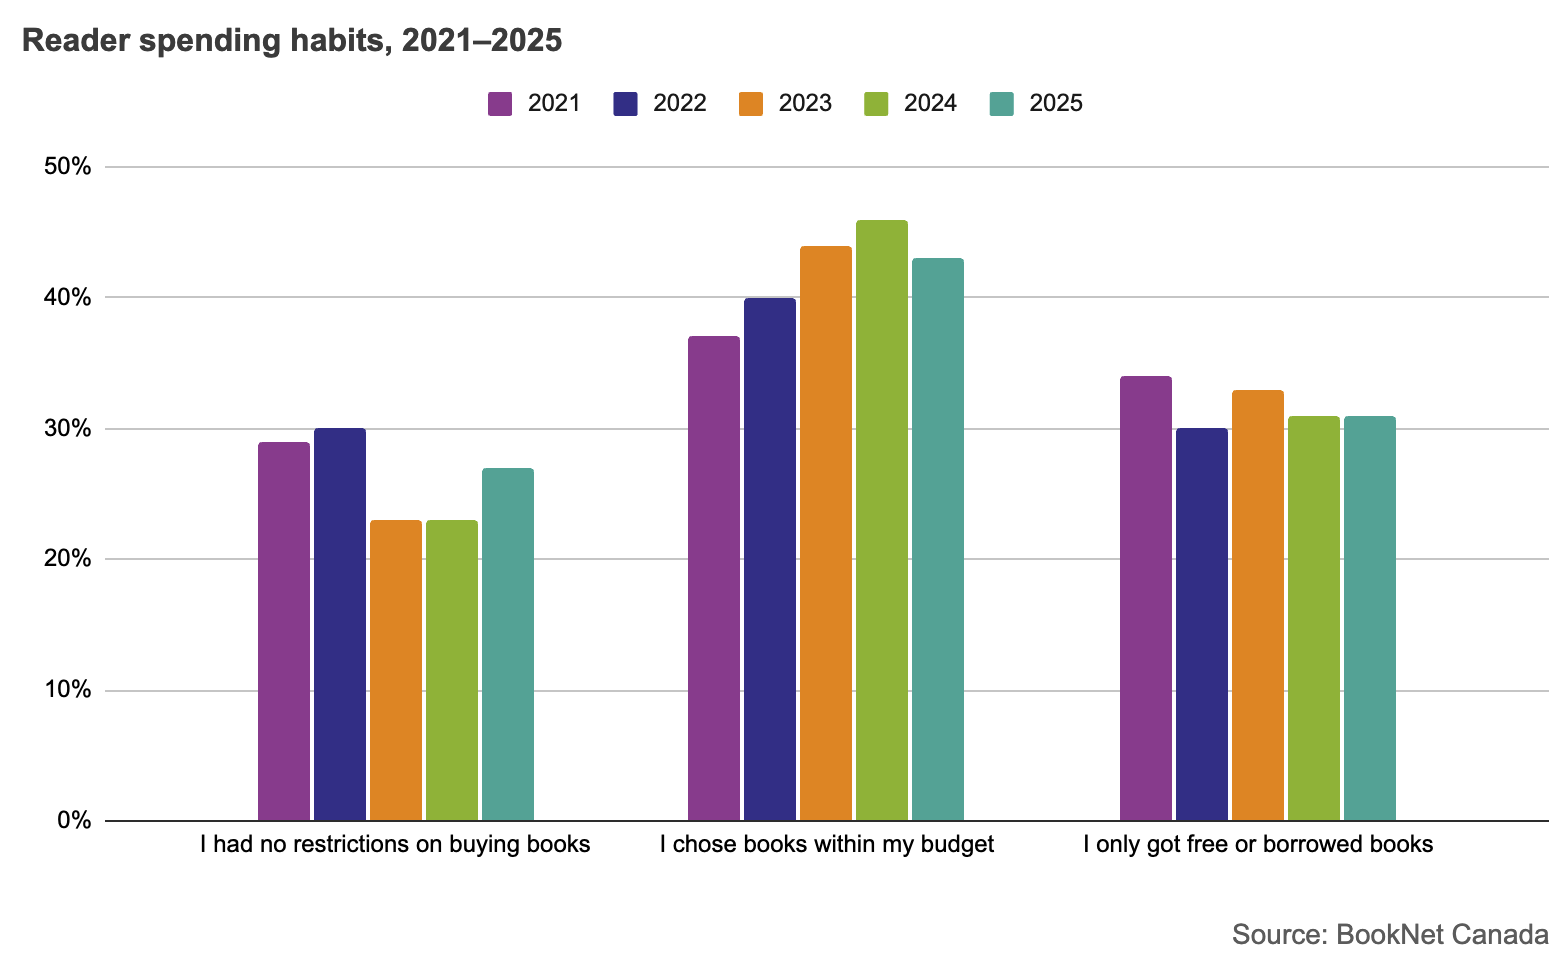
When looking at how readers answered questions about their budget for books, we can see that more readers say they had no restrictions on buying books in 2025 (27%) than did in 2024 (23%). The largest share of readers still chose books within their budget in 2025 (43%) and those who only borrowed or got books for free remained unchanged from 2024 (31%).
Find our source data here.
In 2025, readers spent more on print books than they did on other formats, just as they did in 2024. Once the threshold was $50 or above, print books either tied or came out ahead in each tier of spending. Readers were most likely to spend nothing on ebooks (15%) than other formats and most likely to spend $1-49 on audiobooks (38%).
| Print books | Ebooks | Audiobooks | |
|---|---|---|---|
| $0 | 3% | 15% | 11% |
| $1-49 | 30% | 36% | 38% |
| $50-99 | 25% | 20% | 21% |
| $100-149 | 17% | 11% | 13% |
| $150-199 | 8% | 5% | 5% |
| $200-249 | 6% | 5% | 4% |
| $250-299 | 3% | 2% | 2% |
| $300-349 | 2% | 2% | 2% |
| $350-399 | 2% | 1% | 2% |
| $400+ | 3% | 2% | 2% |
When we look at perceptions of value by format, we can see that most Canadian readers feel like they always or sometimes get good value for the books they buy. In 2025, readers were slightly more likely to only sometimes agree that the print books they bought were good value, ebooks and audiobooks were split fairly equally between “yes” and “sometimes.”
| 2024 | 2025 | ||
|---|---|---|---|
| Yes | 36% | 38% | |
| Sometimes | 45% | 42% | |
| No | 9% | 11% | |
| Ebooks | Yes | 39% | 41% |
| Sometimes | 42% | 41% | |
| No | 10% | 10% | |
| Audiobooks | Yes | 39% | 42% |
| Sometimes | 42% | 43% | |
| No | 11% | 9% |
Format preferences and frequency of reading
Canadian readers continue to prefer print books over any other format. The majority of them would prefer to read print books (58%), followed by ebooks (18%), and audiobooks (16%). The percentage of readers who prefer audiobooks continues to rise — from 8% in 2020 to 16% in 2025. Those without a format preference is similar to previous years at 8% in 2025.
Audiobook listeners were mostly, but not exclusively, listening to digital audiobooks. And this continues to rise as well. In 2025, 30% of audiobook listeners only listened to digital audiobooks and 62% listened to a mix of physical and digital.
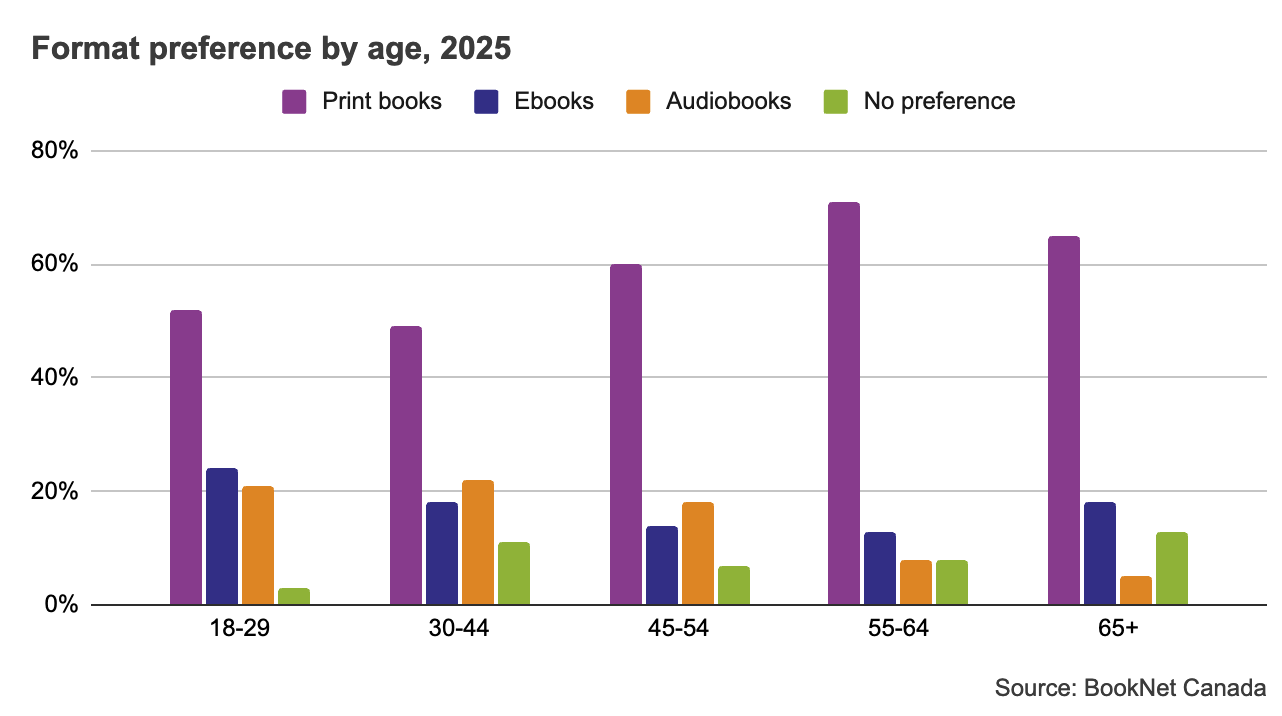
Readers in the 55 to 64 age group continued to be the age group most likely to prefer print books at 71% and 30- to 44-year-olds were least likely to prefer print at 49%. The group that most preferred ebooks were the youngest cohort, 18- to 29-year-olds at 24%. Readers who preferred audiobooks also skewed younger, 22% of readers 30 to 44 preferred them as did 21% of the 18 to 29 group. Readers 65 and over were most likely to not have a format preference (13%).
Find our source data here.
Most readers are flexible when it comes to the format for their reading. Just under a quarter of readers will only read their preferred format (22%). This is the same in 2025 as it was in 2024.
Print book readers are most likely to stick to their preferred format; 28% say that if they could not find the print version of a book, they would not read it in another format. Ebook readers were the most flexible, only 16% would forgo a book if they could not find that format, down from 19% in 2024. Audiobook listeners were also flexible, only 20% would not read the book in another format if the audiobook version wasn’t available. This was unchanged from 2024.

Find our source data here.
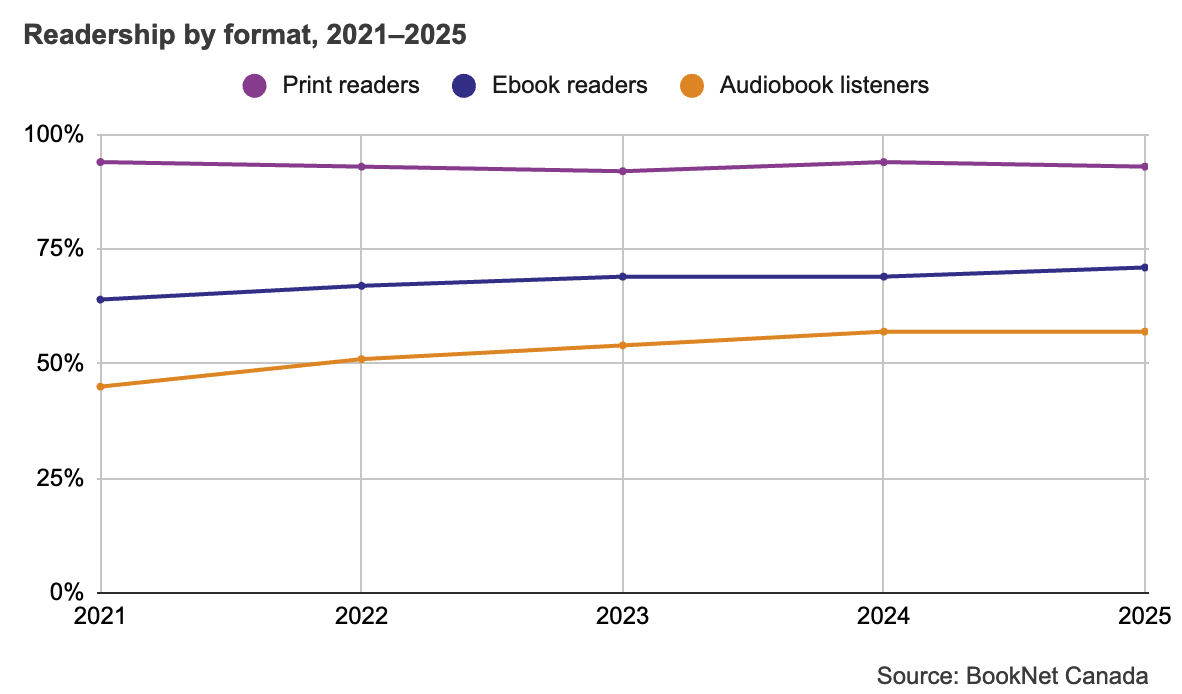
For the first year since 2021, when the percentage of readers who listened to an audiobook at least once in the year was 45%, the share of audiobook listeners remained flat (57% in 2024 and 2025). Readers who read an ebook at least once has continued to increase from 64% in 2021 to 71% in 2025. The vast majority of readers continued to read a print book at least once a year (93%), This has remained fairly steady over the last five years.
Find our source data here.
Across all formats, readers were most frequently reading once a week (print 26%, ebooks 19%, and audiobooks 15%).
| Print books | Ebooks | Audiobooks | |
|---|---|---|---|
| More than once a day | 9% | 6% | 4% |
| Once a day | 20% | 13% | 8% |
| Once a week | 26% | 19% | 15% |
| Once a month | 14% | 11% | 10% |
| Less than once a month | 11% | 10% | 9% |
| A few times a year | 14% | 14% | 11% |
| Never | 7% | 29% | 43% |
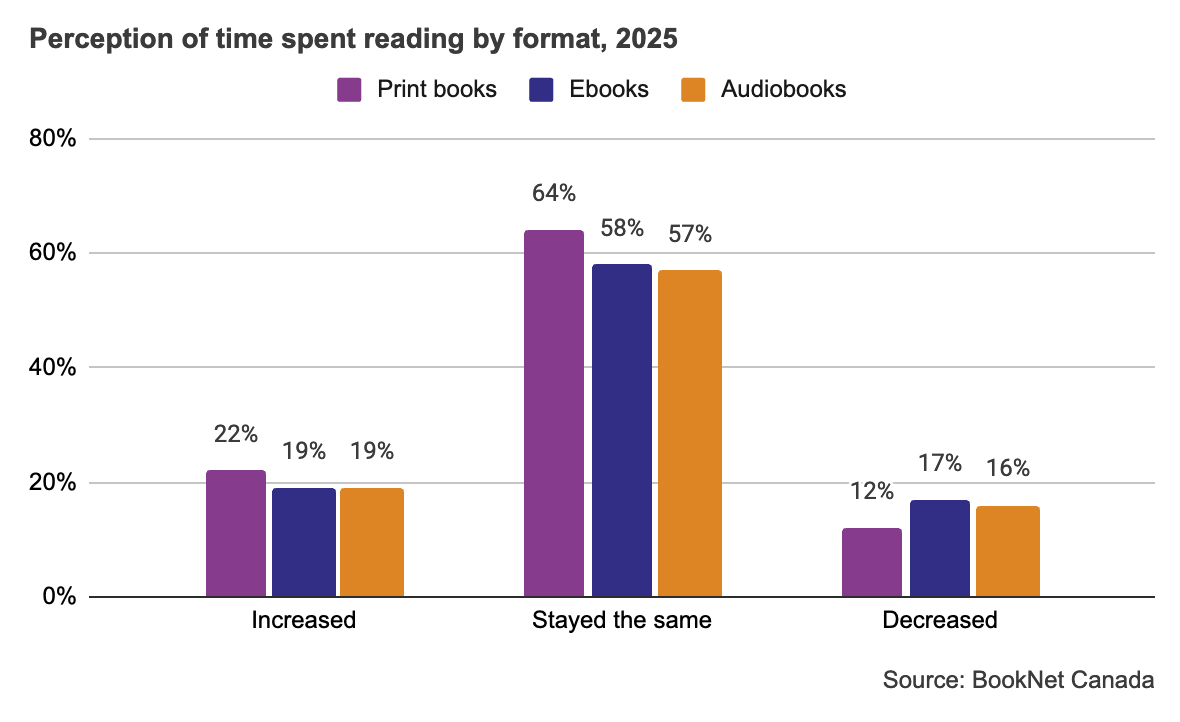
Readers were more likely to say that their reading time had stayed the same in 2025 than they were in 2024 and less likely to say their time had decreased.
Find our source data here.
Number of books read
Just under half of Canadian readers read between one and five books in 2025 (47%) which is up from 45% in 2024. Audiobook listeners were most likely to belong to the group who listened to five or fewer books in 2025 (62%) and print book readers were most likely to read six or more books a year (50%).
Find our source data here.
Reading behaviours and preferences
Most Canadian readers don’t feel obligated to complete books they are not enjoying — 80% say they will not or sometimes will not finish a book they do not like. Just over half of all readers only read or listen to sections of the book that they are interested in at least some of the time (54%).
Many readers also chose to skim or speed read the books they read. Over half of ebook readers did so at least occasionally (55%), as did 48% of print readers. A majority of audiobook listeners change the speed of their books to either be faster or slower (62%).
Print readers show strong preferences for environmental considerations around their books:
- I want books to be made from sustainably-sourced paper (70%)
- I donate or give away a print book after I finish reading it (71%)
- I want my books delivered in ecological-friendly packaging (65%)
And perhaps for environmental reasons, or perhaps for burgeoning “buy Canadian” reasons, 55% of readers wanted to know at least some of the time where their books are printed or shipped from. This is up from 50% in 2024.
In 2025 ebook readers seem split as to whether they prefer ebooks with embedded audio or video, 22% prefer it, 31% sometimes prefer it, 36% do not prefer it, and 11% are unsure.
The percentage of audiobook listeners who at least sometimes prefer audiobooks with sound effects and/or music continues to jump around; from 74% in 2023 to 69% in 2024 to 72% in 2025.
Other audiobook preferences were:
- I prefer listening to a human narrator over synthetic (AI) narration (84%). This is the highest percentage since we started asking this question in 2022 and will be interesting to keep an eye on this trend in future.
- I have stopped listening to an audiobook because of the sound of the narrator's voice (66%).
- I search for specific narrators when looking for audiobooks to listen to (64%).
- I listen to an audiobook while following along in a physical/print book or ebook (59%).
Reading devices and apps
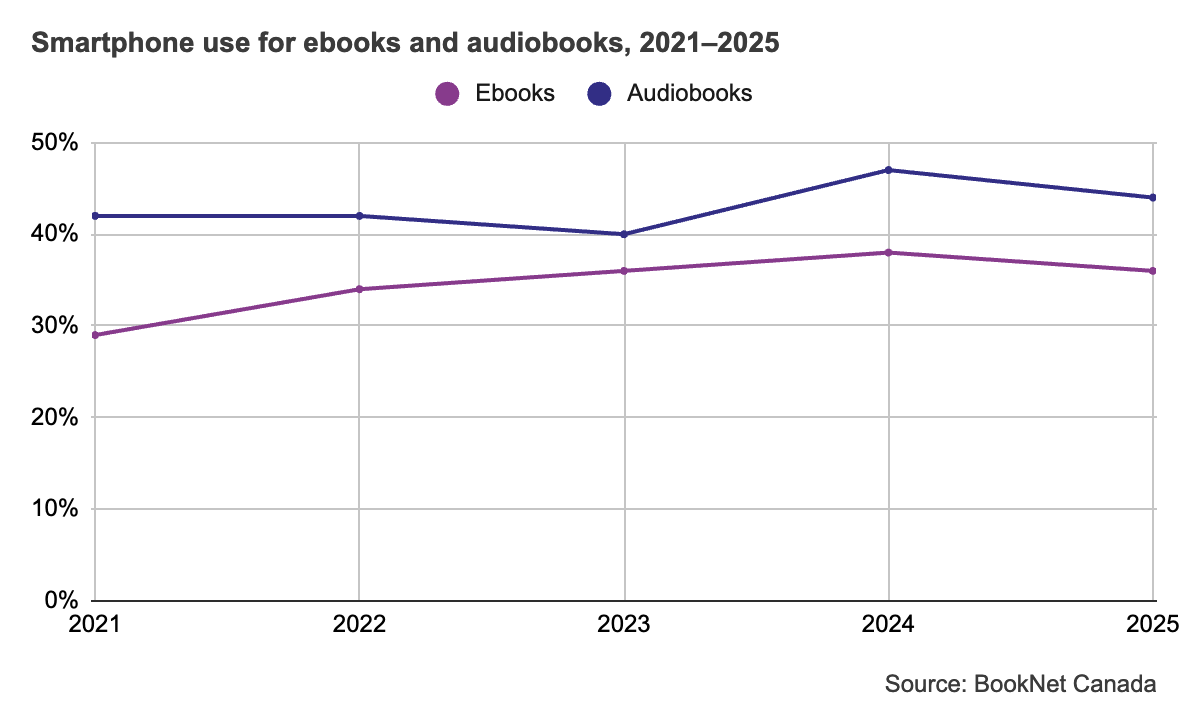
Smartphones continue to be the most popular way for ebook readers and audiobook listeners to use for their reading.
Find our source data here.
However, in 2025 smartphone use is down somewhat for audiobooks (from 47% in 2024 to 44% in 2025) and ebooks (from 38% in 2024 to 36% in 2025). Computers have had a bit of a resurgence for audiobooks (from 14% in 2024 to 16% in 2025) as did tablets for ebooks (from 28% in 2024 to 30% in 2025).
| Ebooks | Audiobooks | |
|---|---|---|
| Smartphone | 36% | 44% |
| Tablet | 30% | 21% |
| Computer | 17% | 16% |
| Dedicated e-reader | 15% | 6% |
| Car stereo | - | 5% |
| Smart speaker | - | 4% |
| CD/tape player | - | 4% |
| Braille display/terminal | 2% | - |
For the seventh year in a row, YouTube is the most popular platform or app used to listen to audiobooks (33%) and Amazon Kindle is the most popular for reading ebooks (31%). Though Spotify (29%) and Audible (24%) are growing for audiobooks, and Kobo (16%) and Internet browsers (25%) are gaining popularity for ebooks.
| Ebooks | Audiobooks | |
|---|---|---|
| YouTube | - | 33% |
| Kindle | 31% | 14% |
| Spotify | - | 29% |
| Internet browser | 25% | 16% |
| Audible | - | 24% |
| Google Books/Google Play | 22% | 16% |
| Kobo | 16% | 9% |
| iTunes/Apple Books | 14% | 9% |
| OverDrive/Libby | 11% | 10% |
| Adobe Reader or Digital Editions | 11% | - |
| Audiobooks.com | - | 11% |
Accessibility and reading features
Print books
While not as many options for accessibility features are available to print readers, we did find that in 2025, 16% of print book readers preferred large print formats, 3% preferred Braille books, and 28% of print book readers used a magnifier to read their books at least some of the time. These numbers are consistent with what we found in 2024 as well.
Ebooks
Three quarters of ebook readers at least sometimes adjust the font or spacing to increase the text size or space out letters/lines (75%) and almost as many used the table of contents for navigating their book (73%). They were also likely to adjust the screen magnification/zoom to make the text larger (71%), and turn on the night display feature (69%).
| Yes | Sometimes | No | |
|---|---|---|---|
| I turn on the night display when reading in dim/low lighting. | 37% | 35% | 24% |
| I adjust font size or spacing to increase the text size or space out letters/lines. | 34% | 42% | 23% |
| I use the table of contents. | 33% | 40% | 24% |
| I use the reading mode on a tablet or smartphone. | 33% | 34% | 28% |
| I adjust the screen magnification/zoom to be larger. | 30% | 40% | 28% |
| I use the Bookmark button. | 29% | 38% | 28% |
| I use the search function. | 27% | 36% | 33% |
| I change text or background colour(s) for a brighter contrast. | 25% | 40% | 31% |
| I use reference page numbers or the percentage metric. | 24% | 31% | 39% |
| I change the text orientation from portrait to landscape. | 21% | 34% | 41% |
| I make notes or highlight text. | 21% | 32% | 45% |
| I turn on the screen reader to use the text-to-speech feature or a Braille device. | 18% | 25% | 53% |
| I use voice control, eye tracking, or switches. | 16% | 24% | 56% |
| I don’t know how to use most or all of these features. | 24% | 32% | 39% |
Readers 55 and over were the ones most likely to use most of the accessibility features in the list above. With the exception of using text-to-speech features or Braille devices; using voice control, eye tracking, or switches; or making notes. This is similar to what we saw in 2024.
Audiobooks
Listeners were most likely to replay parts of audiobooks to re-listen to them (77%), use speakers or hands-free features (76%), or listen to a sample of an audiobook before listening to the whole book (74%). These top three features remain the same as in 2023, but replaying and listening to samples have increased since 2024.
| Yes | Sometimes | No | |
|---|---|---|---|
| I use the speaker, Bluetooth, or hands-free feature. | 37% | 39% | 21% |
| I listen to a sample of the audiobook before I listen to the full audio. | 34% | 40% | 23% |
| I replay parts of the audiobook to re-listen to. | 33% | 43% | 21% |
| I reference the chapter or “minutes left” feature. | 32% | 40% | 24% |
| I use the Bookmark feature. | 30% | 40% | 26% |
| I use the table of contents or chapter list to read ahead. | 29% | 36% | 32% |
| I listen at an increased/faster or decreased/slower speed. | 25% | 37% | 28% |
| I set a timer to stop listening after a certain amount of time. | 23% | 30% | 43% |
| I don’t know how to use most or all of these features. | 27% | 37% | 32% |
Subjects and types of books
Readers across all formats were most likely to read adult fiction: 74% of print book readers, 70% of ebook readers and 68% of audiobook listeners read adult fiction in 2025.
| Ebooks | Audiobooks | |||||
|---|---|---|---|---|---|---|
| 2024 | 2025 | 2024 | 2025 | 2024 | 2025 | |
| Adult fiction | 73% | 74% | 70% | 70% | 65% | 68% |
| Adult non-fiction | 62% | 64% | 54% | 58% | 56% | 58% |
| Young adult books | 17% | 16% | 16% | 15% | 15% | 16% |
| Children’s books | 16% | 13% | 11% | 10% | 14% | 12% |
Breaking down the subjects into genres, we found that most fiction readers chose Mysteries and Thrillers across all formats (52% for print readers, 48% for ebook readers, and 43% for audiobook listeners).
| Print books | Ebooks | Audiobooks | |
|---|---|---|---|
| Mysteries or Thrillers | 52% | 48% | 43% |
| Romance | 29% | 36% | 30% |
| Science Fiction | 33% | 28% | 34% |
| Fantasy | 30% | 31% | 33% |
| Historical Fiction | 32% | 28% | 27% |
| Short Stories | 18% | 19% | 23% |
| Literary Fiction | 19% | 17% | 19% |
| Comics or Graphic Novels | 15% | 13% | - |
| Chick Lit | 6% | 7% | 9% |
| Other fiction subjects | 3% | 1% | 2% |
The distribution of subjects that readers chose in print formats has remained fairly static over the last several years. When we look at ebooks, we can see that Mysteries or Thrillers have jumped from 44% in 2024 to 48% in 2025. And though Chick Lit is at the bottom of the list of subjects, it’s been quietly rising in audiobook format: from 3% in 2021 to 9% in 2025. Something to keep an eye on?
But there’s been an even bigger trend in the ebook format with the rise of Romance books. As we can see in the graph below, in 2021, 28% of readers identified Romance books as a genre they read in ebook format, and that has steadily climbed to 36% in 2025.

Find our source data here.
As for the last three years, History remained the most popular non-fiction genre. But in 2025, print readers were choosing Biographies or Memoirs somewhat more.
| Print books | Ebooks | Audiobooks | |
|---|---|---|---|
| History | 37% | 38% | 38% |
| Biographies or Memoirs | 38% | 28% | 26% |
| True Crime | 32% | 33% | 35% |
| Self-Help | 26% | 26% | 32% |
| Health or Fitness | 24% | 22% | 28% |
| Personal Finance | 16% | 21% | 22% |
| Cookbooks | 21% | 19% | 18% |
| Business | 14% | 17% | 21% |
| Comics or Graphic Novels | 13% | 13% | - |
| Other non-fiction subjects | 6% | 2% | 2% |
True crime was the second most popular genre for audiobook listeners, but it has been growing steadily since 2021.

Find our source data here.
For more on the performance of specific subjects, you can find the subject spotlight series on the BookNet blog where we take a deep dive into the Canadian sales and library circulation of a specific BISAC subject. Or watch our Tech Forum presentation, Trendspotting: Book subjects on the move in the Canadian market to learn more about the emerging trends in the types of books Canadians are buying.
Across all formats and across all subjects and genres, in 2025, Canadians read:
- Books that have been made into movies or TV shows: 44% in 2025, up from 41% in 2024
- Books with a sequel (duology, trilogy, series, etc.): 37% in 2025, up from 35% in 2024
- Comics, manga, or graphic novels: 23% in 2025
- Books written in a language other than English: 17% in 2025
- Poetry, books in verse, or plays: 16% in 2025
For the readers who had read a book in a language other than English, the top languages were French (38%) and Spanish (11%).
| 2021 | 2022 | 2023 | 2024 | 2025 | |
|---|---|---|---|---|---|
| French | 28% | 37% | 30% | 28% | 38% |
| Spanish | 8% | 10% | 13% | 15% | 11% |
| Italian | 4% | 8% | 6% | 8% | 9% |
| Mandarin | 9% | 12% | 8% | 13% | 8% |
| Arabic | 3% | 6% | 5% | 13% | 7% |
| Punjabi | 7% | 8% | 10% | 11% | 7% |
| Tagalog | 3% | 6% | 6% | 6% | 7% |
| Urdu | 5% | 8% | 10% | 8% | 7% |
| Cantonese | 5% | 4% | 6% | 6% | 6% |
| Russian | 6% | 3% | 8% | 8% | 5% |
| German | 4% | 6% | 6% | 9% | 5% |
| Something not listed | 30% | 25% | 31% | 24% | 22% |
Diversity and representation in books
The majority of readers agree or sometimes agree that books should be representative of a variety of experiences (90% in 2025, up from 87% in 2024). They also believe it is or sometimes is important that authors accurately represent their material through research, fact-checking, and/or hiring reviewers and sensitivity or beta readers (88%). This is up from 85% in 2024. For all items in the table below, there has been a decline in respondents answering “No” when compared to 2024.
| Yes | Sometimes | No | |
|---|---|---|---|
| Books should be representative of a variety of experiences. | 54% | 37% | 5% |
| It is important that authors accurately represent their material through research, fact-checking, and/or hiring reviewers and sensitivity or beta readers. | 49% | 39% | 5% |
| A greater variety of authors should be published and stocked. | 40% | 40% | 8% |
| It is important that books about a group or culture should be written by people from that group or culture. | 35% | 36% | 18% |
Just under a fifth of Canadian readers had read at least one book that fell into one of the categories below in 2025 (17%).
| 2021 | 2022 | 2023 | 2024 | 2025 | |
|---|---|---|---|---|---|
| Books by or about people who belong to religious minorities | 14% | 14% | 17% | 17% | 13% |
| Books by or about Black, Indigenous, or person/people of colour | 19% | 14% | 16% | 15% | 18% |
| Books by or about people with immigrant status | 13% | 12% | 16% | 14% | 13% |
| Books by or about disabled people | 10% | 10% | 12% | 12% | 11% |
| Books by or about LGBTQIA+ people | 8% | 8% | 9% | 8% | 10% |
About BookNet Canada
BookNet Canada is a non-profit organization that develops technology, standards, and education to serve the Canadian book industry. Founded in 2002 to address systemic challenges in the industry, BookNet Canada supports publishing companies, booksellers, wholesalers, distributors, sales agents, and libraries across the country. Industry-led and partially funded by the Department of Canadian Heritage, BookNet Canada has become, as The Globe and Mail puts it, “the book industry’s supply-chain nerve centre.”
BookNet Canada acknowledges that its operations are remote and our colleagues contribute their work from the traditional territories of the Mississaugas of the Credit, the Anishinaabe, the Haudenosaunee, the Wyandot, the Mi’kmaq, the Ojibwa of Fort William First Nation, the Three Fires Confederacy of First Nations (which includes the Ojibwa, the Odawa, and the Potawatomie), the Métis, as well as the unceded and ancestral territory of the Musqueam, Squamish, or Tsleil-Waututh peoples, the original nations and peoples of the lands we now call Beeton, Guelph, Halifax, Thunder Bay, Toronto, Vancouver, Vaughan, and Windsor. We endorse the Calls to Action from the Truth and Reconciliation Commission of Canada and support an ongoing shift from gatekeeping to spacemaking in the book industry.
The book industry has long been an industry of gatekeeping. Anyone who works at any stage of the book supply chain carries a responsibility to serve readers by publishing, promoting, and supplying works that represent the wide extent of human experiences and identities in all that complicated intersectionality. BookNet is committed to working with our partners in the industry as we move towards a framework that supports "spacemaking," which ensures that marginalized creators and professionals all have the opportunity to contribute, work, and lead.
BookNet Canada’s services and research help companies promote and sell books, streamline workflows, and analyze and adapt to a rapidly changing market. BookNet Canada sets technology standards and educates organizations about how to apply them, performs market research, and tracks 85% of all Canadian English-language print trade book sales through BNC SalesData.
BookNet Canada has extensive research available on our website, both free and for purchase.
- Canadian Book Consumer Study 2024: New results from our quarterly survey of Canadians about their book buying, borrowing, and more in 2024.
- The Canadian Book Market 2025 (Paid) is our annual comprehensive report on the Canadian market. Contains detailed information on more than 50 subject categories, including market share, weekly unit sales, average selling price, top 10 hardcover and paperback sellers, and public library lending information.
- The State of Publishing in Canada 2023 offers a comprehensive look at the Canadian English-language publishing landscape and explores publishers' operations and staffing, revenue and sales, distribution, format-specific publishing programs, and more.
To stay updated on current and future research, subscribe to our monthly Research newsletter. To stay up-to-date on all BookNet Canada news and information, subscribe to our weekly eNews.
If you have any questions or comments about this or other studies, please contact the research team at research@booknetcanada.ca.
Learn more at booknetcanada.ca.


This free report looks at how Canadians are spending their leisure time and the behaviours of Canadian readers in 2025.