
You weren’t imagining it — with more and more TV shows available on streaming sites than ever before, the number of books adapted into TV shows has only increased over the last decade.
We’ve also been hearing from some of you that you’re interested in getting more data about book to screen adaptations and the impact they have on Canadian book sales and Canadian library circulation. So we’re putting together this new blog mini-series with the latest research and will be releasing a must-read forthcoming study later this year (sign up for the research newsletter to be notified when it’s released).
In this instalment, we’re taking a look at books adapted for the small screen.
Using SalesData, our national sales tracking service for the Canadian English-language trade book market, and LibraryData, our national Canadian library collection and circulation analysis tool, we’ve gathered data on the sales and library circulation for titles related to 30 different TV show adaptations that were released in 2020 and 2021.
Which 30 TV shows made the cut? This list was determined from the average ratings and number of reviews on IMDb, Rotten Tomatoes, and Metacritic for each show. We then chose the top 15 TV shows adapted from books each year. Check out the list below:
TV show adaptations released in 2020
Brave New World
Bridgerton
Dash & Lily
I Know This Much Is True
Little Fires Everywhere
Normal People
Stargirl
The Queen’s Gambit
The Outsider
The Undoing
The Flight Attendant
The Stand
The Good Lord Bird
The Babysitter’s Club
The Pale Horse
TV show adaptations released in 2021
Behind Her Eyes
Dopesick
Firefly Lane
Foundation
Hawkeye
Invincible
Jupiter’s Legacy
Maid
Nine Perfect Strangers
Shadow and Bone
Station Eleven
The Falcon and the Winter Soldier
What if…?
Wheel of Time
Y: The Last Man
About the data
SalesData and LibraryData store ISBNs differently. While SalesData gathers data for each individual ISBN, LibraryData uses ISBN clusters. These ISBN clusters may contain any number of ISBNs related to one title or to a series of books.
In order to compare Canadian book sales and Canadian library circulation, the ISBNs related to each TV adaptation were taken first from LibraryData clusters. This same list of ISBNs was then used to gather data from SalesData.
All to say, if a TV show was related to an entire series of books, all titles in the series were considered together.
These 30 book to TV show adaptions numbered 660 ISBNs altogether:
The smallest number of ISBNs related to one TV adaptation is 2 ISBNs.
The largest number of ISBNs related to one TV adaptation is 173 ISBNs.
While each TV adaptation had 22 related ISBNs on average, the median number of ISBNs was 6.5.
What effect does this have on the results? We explore the differences between the sales and library circulation of titles related to TV shows adapted from book series and individual books below.
And with that out of the way, grab your popcorn!
On the small screen
It would make sense that when a hit TV show is based on a book, that that book also gains popularity, and that’s exactly what we see for the titles adapted into our 30 TV shows.
The graph below shows the sales for these titles from 12 weeks pre-release to 12 weeks post-release of their respective TV shows. Overall, sales for these titles increased 423% over these 25-week periods. Looking more closely, there is a significant 78% spike in sales between the week of the TV shows' release and the week after, and sales reached their peak in the eighth week post-release.
Sales for titles adapted into TV shows in 2020 and 2021

The library circulation of these titles tells a bit of a different story. The circulation of titles by a library works fundamentally differently from the sales of titles by a bookstore. A library’s ability to circulate titles is ultimately limited by the number of copies it holds in its collection. That’s why library holds, rather than library loans, can show a clearer picture of library book borrowers' interest in a particular title.
Looking at the graph below, while the number of library loans for these titles increased 57% over the 12 weeks pre-release to 12 weeks post-release, the greatest change is in the number of holds placed on these titles. Comparing the two lines, there are 517% more holds than loans during these 25-week periods. The number of holds also increased during this time period, up 109% and reached their peak in the tenth week after the TV shows had been released.
Library circulation for titles adapted into TV shows in 2020 and 2021

What’s also interesting to notice is that instead of a stark increase in library circulation after the TV shows' releases, there is a steady gain in both loans and holds in the lead up to the release of the shows. Were these titles already popular in the library? Are library book borrowers keener to read before they watch? Do they have to plan ahead to put holds on titles farther in advance than those who buy the book?
The impact of the COVID-19 pandemic
In 2020 and 2021, we saw in-store shopping restrictions and library closures across the country due to the pandemic. What impact did this have on the sales and library circulation of titles adapted into TV shows?
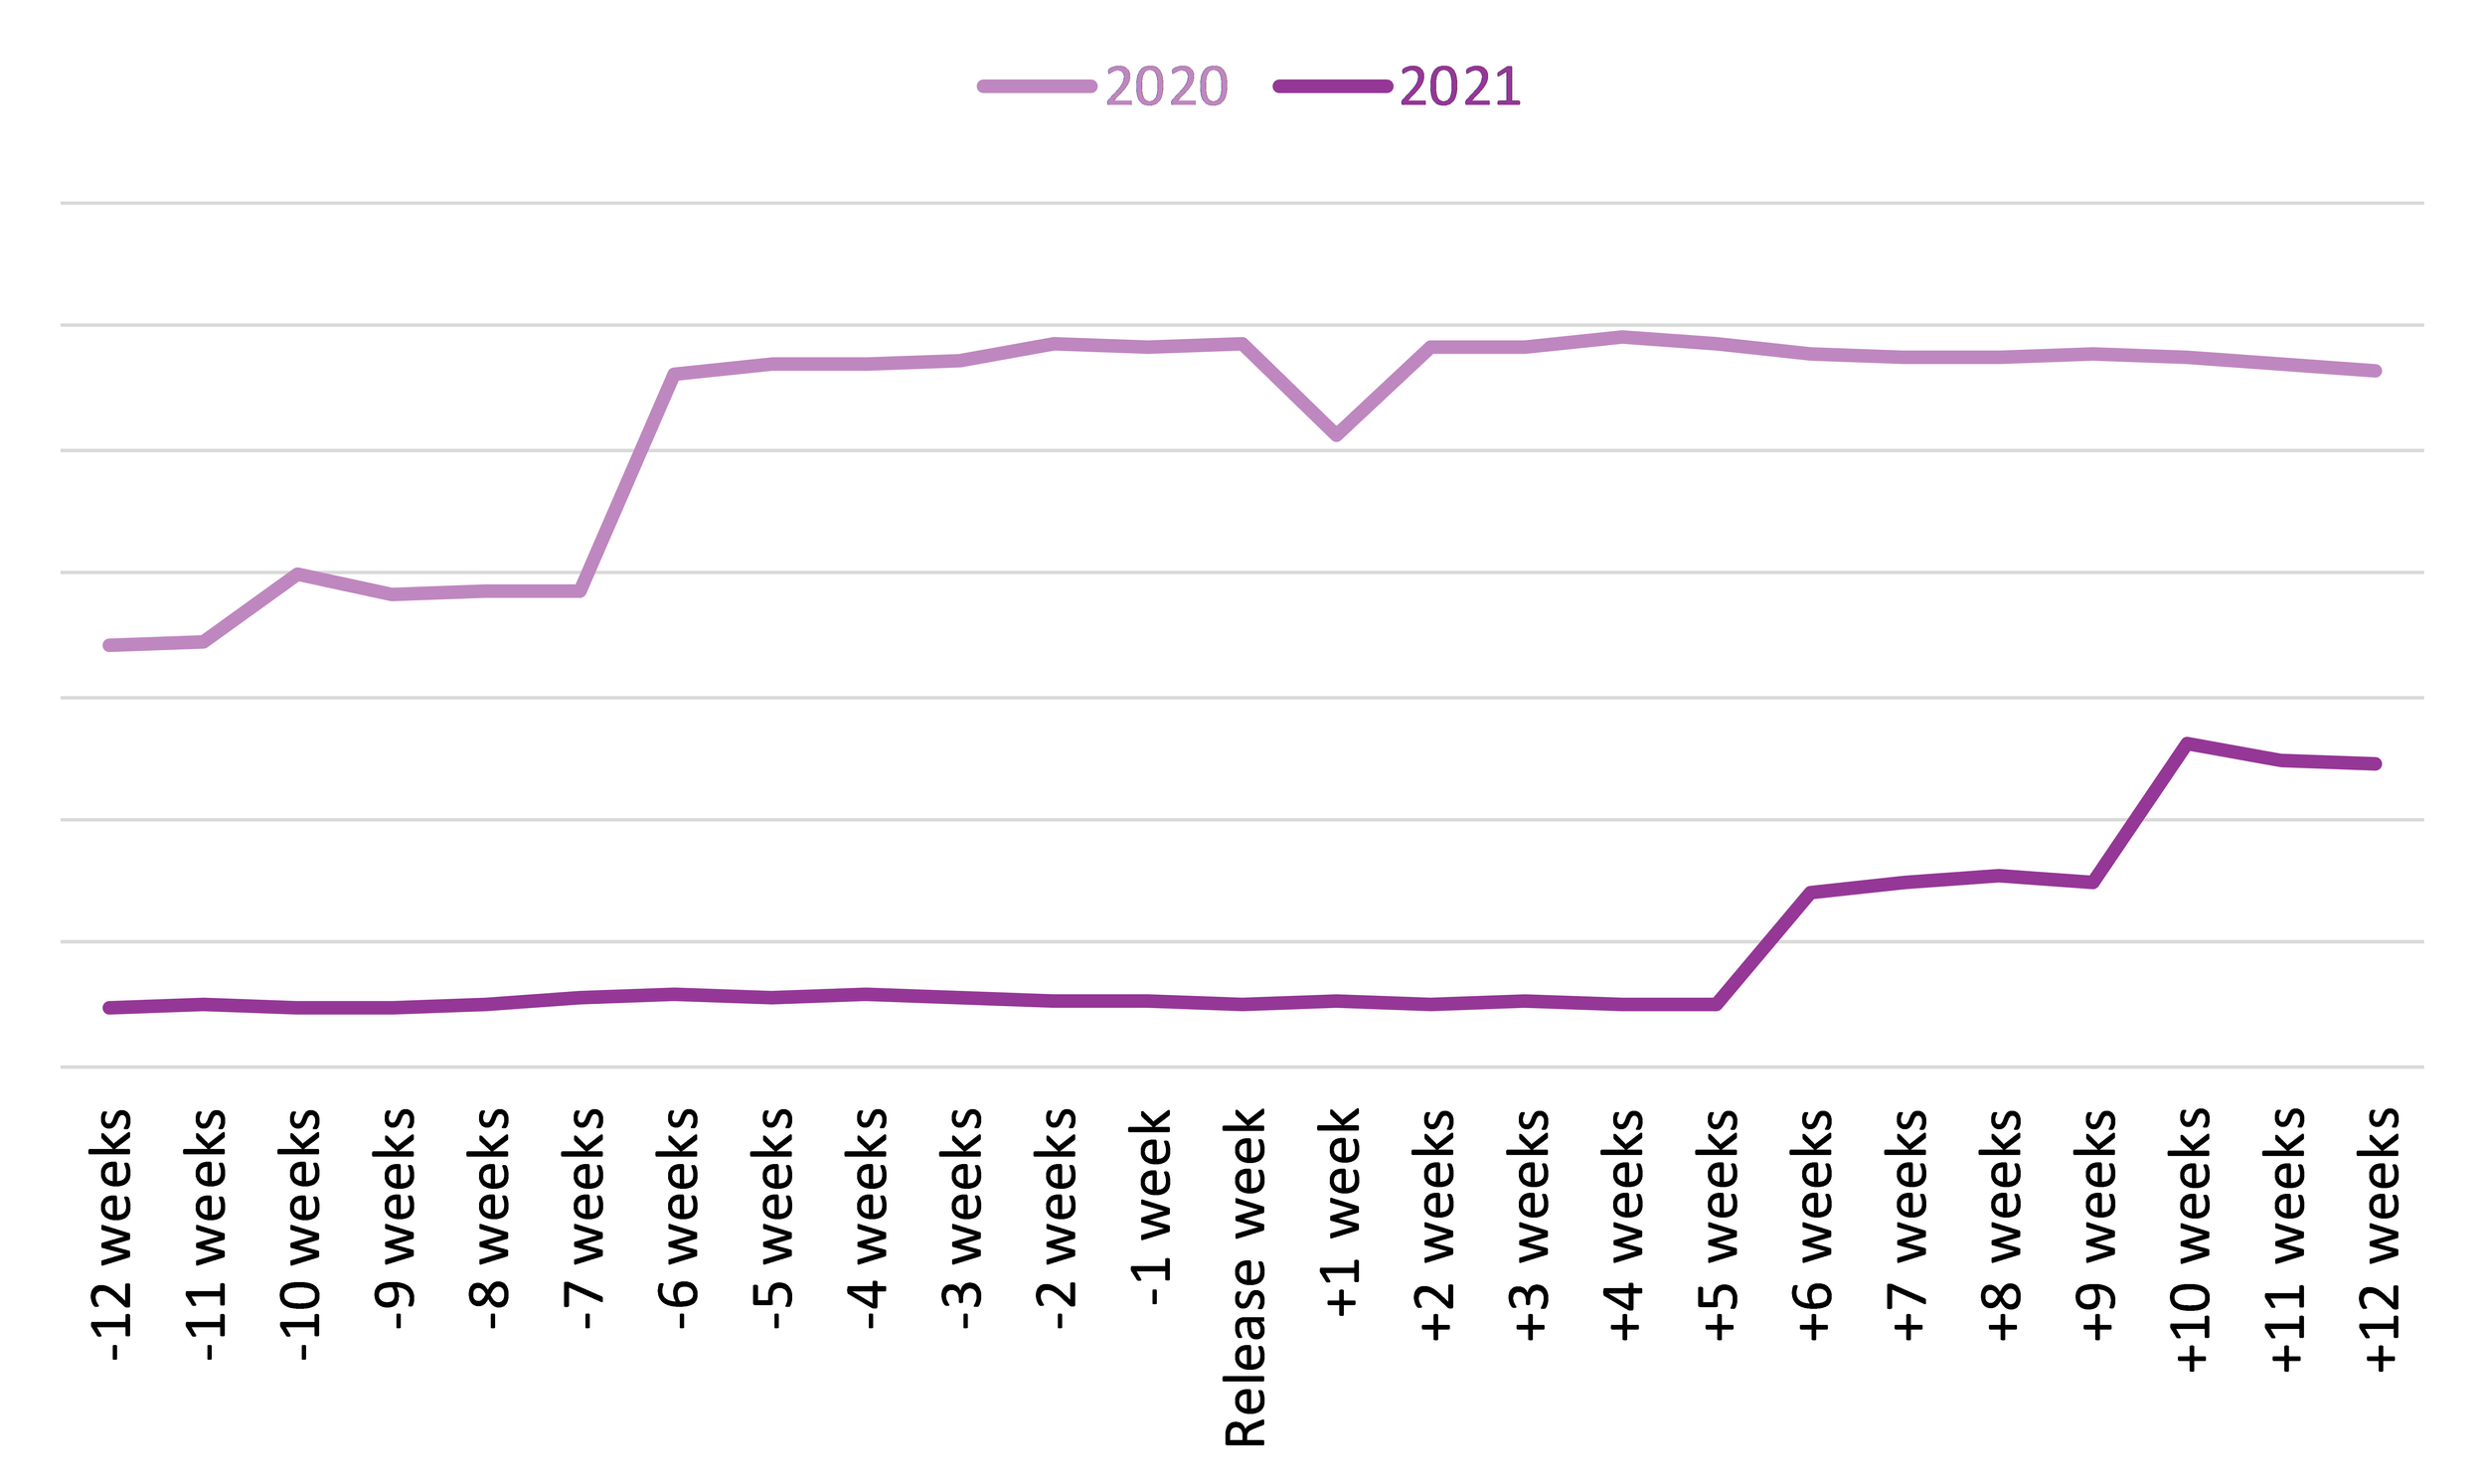
The sales trends for titles adapted into TV shows in 2020 and 2021 look quite different, shown in the graph below. In 2020, sales increased 54% between the week of the TV shows' releases and the first week post-release, but sales only reach their peak in the eighth week post-release, up 170% from the release week. In 2021, sales only increase once significantly — up 105% the first week after the release of the TV shows. This difference in trajectory may be due to pandemic restrictions in 2020.
Sales for titles adapted into TV shows in 2020 vs. 2021

The library circulation for these titles in 2020 and 2021 is also very different, shown in the graph below. In 2020, the number of holds over these 25-week periods was more or less sustained. While holds did increase 14% between the first and second week after the TV shows have been released, the biggest increase in holds actually happened in the sixth week before the TV shows had been released — up 46%.
In stark contrast are holds for titles adapted into TV shows in 2021. In 2021, increases in library holds for these titles begin in the sixth week after the TV shows have been released — up 187%. The number of holds continues to rise from there and reach their peak in the tenth week post-release.
Holds for titles adapted into TV shows in 2020 vs. 2021
Considering that many libraries had to close their doors for long stretches of time in 2020, it’s possible that this sustained number of holds is due to library book borrowers being unable to access their library branch to take books out on loan during these 25-week periods. It’s also possible that these holds are related to a series of books, which would also increase this number.
Looking at the number of library loans, in this case, reveals trends that are a bit more familiar, shown in the graph below. In 2020, loans for these titles shot up 48% between the first and second week after the TV shows had been released, and reached their peak number of loans at six weeks post-release. In 2021, there were less definitive increases in the loans of titles adapted into TV shows, with a significant spike happening by the seventh week post-release.
Loans for titles adapted into TV shows in 2020 vs. 2021

There’s nothing like a good book
For the 30 TV show adaptations that we tracked, 60% were based on Fiction titles, 30% Non-Fiction, and only 10% Juvenile and Young Adult titles. But that doesn’t mean that Juvenile and Young Adult titles weren’t popular.
Looking at sales, both Fiction and Juvenile and Young Adult titles topped the charts. Sales for Fiction titles adapted into TV shows increased 383% and Juvenile and Young Adult sales increased 979% from pre-release to post-release. Non-Fiction sales also increased 465% over these 25-week periods, but occupied a much smaller marketshare.
For library circulation, Fiction titles stand out as the most popular subject, shown in the graph below. Holds for Fiction titles increased 93% over these weeks. While Juvenile and Young Adult holds increased by 198%, Non-Fiction holds actually decreased by 9% overall.
Holds by subject for titles adapted into TV shows in 2020 and 2021

Whether a book belongs to a series or is a standalone title also makes a difference in terms of sales and library circulation for titles adapted into TV shows.
Looking at the graph below, the sales of series titles increased 567% over these 25-week periods and reached their peak in the ninth week after the TV shows have been released. In contrast, sales of individual titles increased 251% overall and peaked at the first week post-release — up 47%.
Sales for series and individual titles adapted into TV shows in 2020 and 2021

For the library, holds for series titles increased steadily by 191% over the entire 25-week period. In contrast, holds for individual titles decreased 1% overall, down after an increase of 106% in holds during the sixth post-release.
The magic of television
Gone are the days when a TV show would only air at a set time every week. But with new options and platforms to watch TV shows only comes more questions — does a complete release of a TV show, ripe for binging, or a gradual release of a TV show, week-by-week, make a difference in the popularity of the books upon which they’re based?
For the titles adapted into our 30 TV shows, sales for titles with TV shows that were released completely and gradually both saw significant increases around the TV shows' releases, shown in the graph below. For complete releases, there was a 98% increase in sales between the release weeks and the first week after the releases, with another sales peak at the ninth week post-release. For gradual releases, there was one 135% increase in sales from the week before the TV shows' release to the first week post-release.
Sales by release type for titles adapted into TV shows in 2020 and 2021

In the library, holds for titles with TV shows that were released completely increased steadily — 154% over the 25-week period. For gradual releases, holds saw a significant spike of 78% at the sixth week post-release.
And what about timing?
The Canadian book market already sees a boost in sales during the fourth quarter of the year and on top of that, it’s also when the majority of our TV shows were released — 40% of them.
So, it should come as no surprise that titles for TV shows released at the end of the year also had the greatest number of sales. Sales for titles with TV shows released during the fourth quarter increased 909% over their 25-week period, while sales for titles with TV shows released during the third, second, and first quarters saw slightly smaller increases in sales — 608%, 142%, and 277% respectively.
Library circulation also favours titles for TV shows that were released during the fourth quarter, shown in the graph below. Here, holds for titles with TV shows released during the fourth quarter increased 260% pre-release to post-release and holds for titles with TV shows released during the third quarter increased 176%. In contrast, the number of holds for titles with TV shows released during the second and first quarters actually decreased — 13% and 64% respectively.
Holds by TV show release date for titles adapted into TV shows in 2020 and 2021

Curious for more data on book to screen adaptations? Keep your eyes peeled on our blog and sign up for the research newsletter to be the first to know about our upcoming research studies.
Stay tuned!


What’s trending for audiobooks in 2026?