
It’s the time of the year we all look forward to: when the full results of our Canadian Book Consumer survey are ready to be shared!
We’ll be sharing them in a three-part blog series. Part one of this mini blog series will focus on Canadians who bought at least one book in March, June, September, or December 2020; part two will focus on the paths Canadians take to acquire books; and part three will compare and contrast buyers and library borrowers.
Before we get into the details, we’d like to provide you with some context and language considerations that will help you better understand the survey results:
The Canadian Book Consumer survey is fielded quarterly. The results we’ll share today are from surveys fielded in April, July, and October 2020 and January 2021 among 12,022 English-speaking Canadians over the age of 18 who met our screening criteria.
Most of the answers we’re sharing in this series are from questions that asked respondents about their last month’s book-related behaviour:
‘Buyers’ are respondents who said they had bought at least one new book in either March, June, September, or December 2020 (a total of 2,750 Canadians).
‘Non-buyers’ are respondents who didn’t buy at least one new book in the past month.
'Borrowers’ are respondents who said they visited a public library (in person or online) and checked out at least one book in either March, June, September, or December 2020 (a total of 2,980 Canadians).
Some questions asked respondents about their book-related behaviour in the last year:
‘Readers’ are respondents who said they had read at least one book in the last year, for a total of 8,528 Canadians. (Readers could be buyers or non-buyers.)
When we use the term ‘book(s)’, we’re referring to new print books, ebooks, and/or audiobooks combined, unless specified.
Now that you’re armed with the knowledge to fully understand these results, let’s get started!
The first thing we learned is that 2,750 of our survey respondents said they bought at least one new book the prior month, in this case, March, June, September, or December 2020. We wanted to find out what formats and subjects did they buy? Where were they buying their books? Why did they buy them there?
Book formats
About 75% of purchases were print books, while digital books made up about 25% of purchases. As the graph below shows, paperback purchases made up about half of book purchases and 25% of purchases were hardcovers. Paperback purchases trended slightly down from 2018 to 2020. Hardcover purchases were mostly flat, with increases in Q4 each year, corresponding to the holiday shopping season in December. Audiobook purchases hovered between 2% and 8%, trending slightly upwards over the last few years.
Purchases by book format 2018–2020

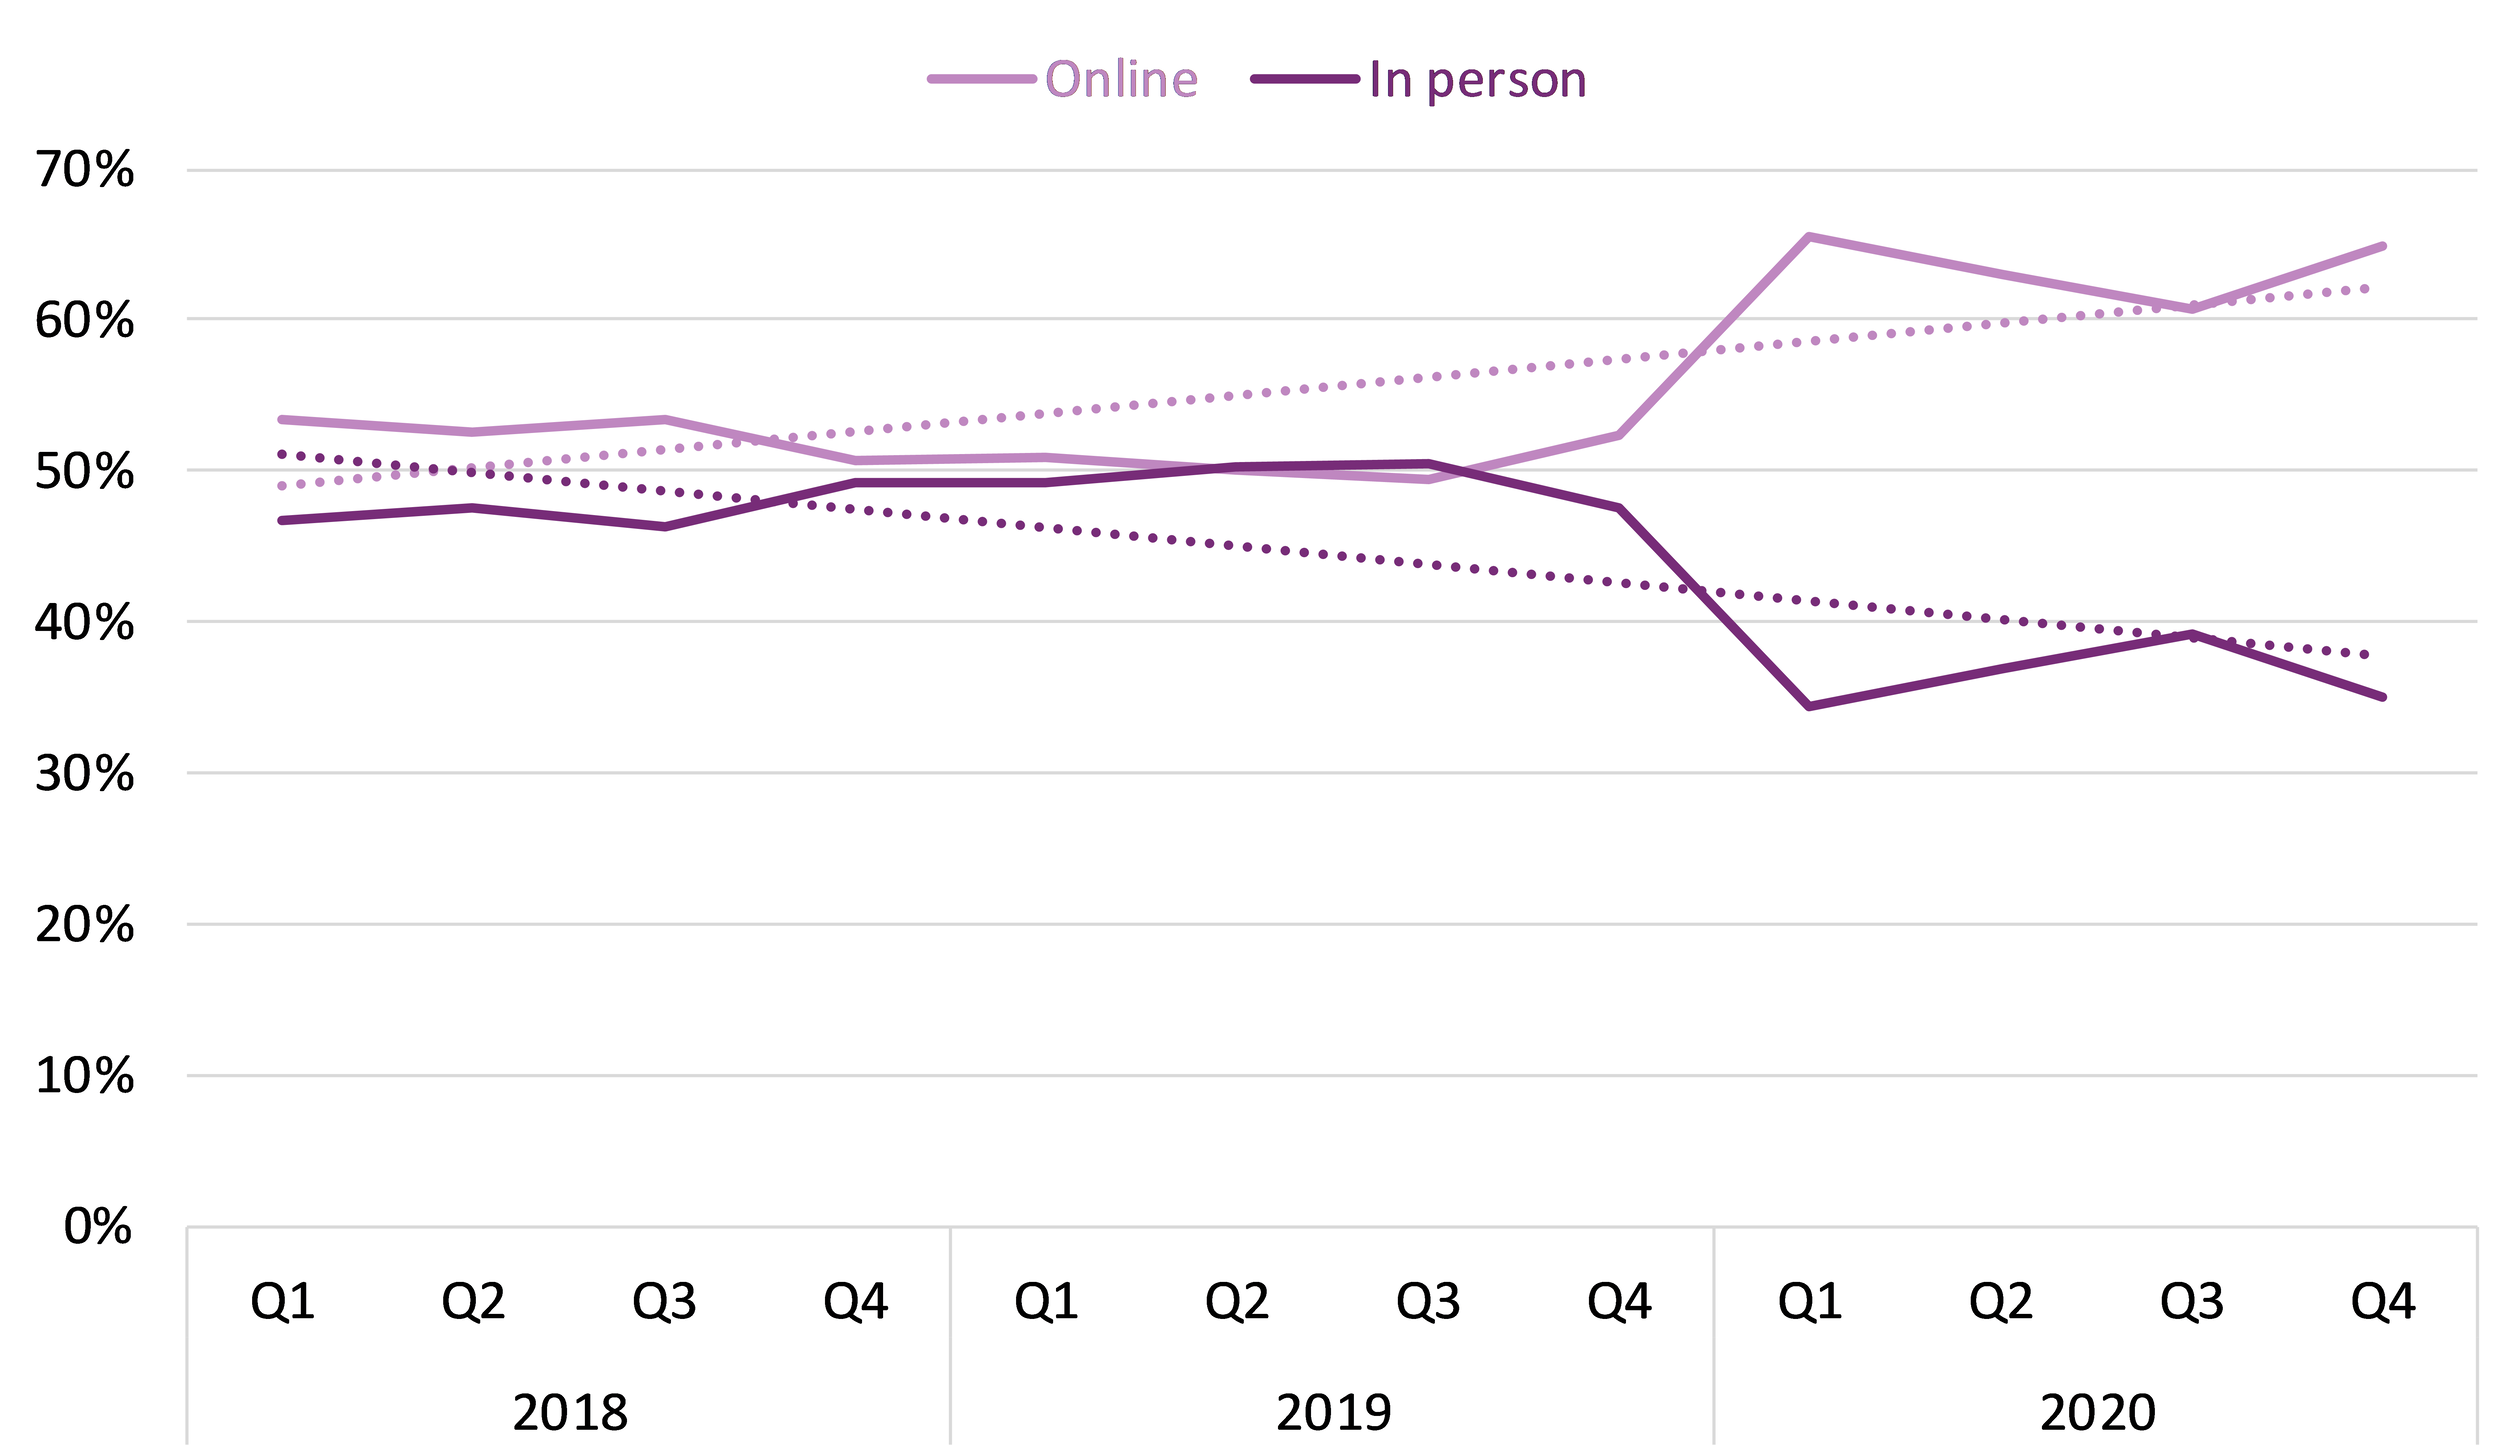
Online vs. in-person
Are books mainly being purchased online? It depends on when the purchase was made. Online and in-person purchases were split exactly 50/50 in the second quarter of 2019, while in the first quarter of 2018 there was a difference of 7% between the two channels. At the end of 2019, online purchases were trending slightly down. However, purchases made in March 2020 began to move more online. Which makes sense considering that many physical stores closed, or were closing, because of pandemic-resulted lockdowns. At the end of 2020 in December, online purchases rose to 65%, a 24% increase from the fourth quarter in 2019. Overall in 2020, 64% of purchases were made online (website or app), with 36% of purchases bought in person.
Purchases by channel 2018–2020
Where are people buying?
In 2020, 50% of purchases were bought via an online retailer, 23% at a bookstore, 12% from a general retailer or grocery store, and 7% from both mobile apps and ebook/audiobook stores. About three quarters of Canadians bought where they did because of the price (74%). They also bought because the book(s) were in stock or available immediately (71%) or it was a convenient place to shop (69%).
Other reasons people gave for why they bought where they did:
Good selection of books (63%)
Cheap or free delivery (49%)
Easy checkout process (47%)
Easy to navigate (45%)
Good service (42%)
Loyalty card or subscription (35%)
Already shopping there for other items (34%)
Happened to see the book there (33%)
Enjoy shopping there (28%)
It’s a habit (28%)
The shop’s COVID-19 protective measures (27%)
Ability to look inside the book or read an extract before buying (24%)
To support the shop (14%)
Money decisions and perceived value
Slightly more than half of buyers bought their books at full price (55%), while 28% bought a discounted book. The rest used a coupon or bought the book as part of a multi-buy deal or subscription.
The average price paid by format was:
$16.34 for paperbacks
$22.98 for hardcovers
$11.62 for ebooks
$14.38 for audiobooks
When we look at the perceived value by format, digital book buyers rated the value for their money higher than did print book buyers. There was a larger difference between a rating of excellent and good between print and digital books.
About half of those who had purchased a book in the last month, said that they received excellent value for their money at the price they paid for the purchases (48%). And, about one third rated the purchases as good value (38%). Overall, when rated out of 5 (the top rating), paperbacks and hardcovers each were rated 4.3, ebooks were rated 4.4, and audiobooks were rated 4.5.
Perceived value by format

Books bought by format
In 2020, buyers on average bought 1.8 print books, 0.9 ebooks, and 0.3 audiobooks in the prior month.
When we look at the average of books bought by format, we see that
print buyers buy, on average, a higher number of print books (2.3) than ebooks (0.5) and audiobooks (0.2);
ebook buyers bought an average of 2.7 ebooks in the prior month, compared with 1.2 print books and 0.6 audiobooks; and
audiobook buyers bought, on average, 2.2 audiobooks, 1.7 print books, and 1.6 ebooks in the prior month.
When making their purchase, about eight in ten buyers only bought a book(s) (79%). However, 21% bought additional non-book items with their book(s) purchase, mostly groceries, then clothing, toys, or games. And, about a quarter of people said they add books to their online cart to get free shipping (27%), and about a third of people sometimes do so (38%).
Planned vs. impulse purchases
Were these book purchases an impulse or planned ahead of time? In 2020, 37% of people had planned ahead to buy the particular book at that specific time, while 23% planned to buy a book at that specific time, but not that particular book, and 20% planned to buy that particular book, but not necessarily at that specific time. In comparison, 17% of people made impulse book buys both in terms of the book and the timing.
And, as we mentioned previously, people bought from where they did because they were already shopping there for other items (34%) and they happened to see the book there (33%).
Planned purchases by book and/or time

The increase of planned book purchases in December 2020 is likely due to the holiday shopping season. The percentage of gift purchases increased by 11% from 16% in September 2020 to 27% in December, the increase was the same in 2019. In December 2019, gift purchases also increased by 11%, from 17% to 28%. And, in September 2018 gift purchases were lower at 13%, leading to a 17% increase in gift purchases back up to 30% in December 2018. And, as we learned above, online and in-person purchases were split almost 50/50 in the last half of both 2018 and 2019.
Did the pandemic have an impact on their book buying habits? Regardless of whether book purchases were for themselves or others, 24% of buyers in the last three quarters of 2020 said that COVID-19 was impacting their book buying but slightly over half of buyers disagreed (55%).
Genres and subjects
So, what genres of books are people buying? About three quarters of people classified their book purchases as adult books (72%), with 17% classified as young adult, and 10% as children’s/middle grade books. Of adult and young adult book purchases, most were Fiction (59%).
Popular Fiction sub-genres:
Suspense and thrillers (18%)
Fantasy (17%)
Mystery/detective (15%)
Popular Non-Fiction sub-genres:
Biographies or memoirs (25%)
Self-help (14%)
History (12%)
How do these self-identified popular subjects purchased (of all formats) compare to the subjects we know are bought in print? Retailer-provided sales of new (not secondhand or used) print books categorized by BISAC subject codes via BookNet’s SalesData show these popular sub-genres for Fiction and Non-Fiction in 2020 ranked as follows:
Fiction
Fiction / Thrillers
Fiction / Romance
Fiction / Women
Non-Fiction
Non-Fiction / Biography & Autobiography
Non-Fiction / Cooking
Non-Fiction / Self-help
Want to stay on top of all things research? Subscribe to the BookNet research newsletter to get updates about upcoming studies, reports, and of course, the next instalment of this series.


Find out what titles made it to the May 2024 Loan Stars Junior Canadian top 10 list.